By NE – nakedemperor.substack.com
As many have pointed out, the UK Health Security Agency will stop publishing many of their Covid figures. So whilst they are still available, I take a look at the latest vaccine surveillance report, published yesterday.
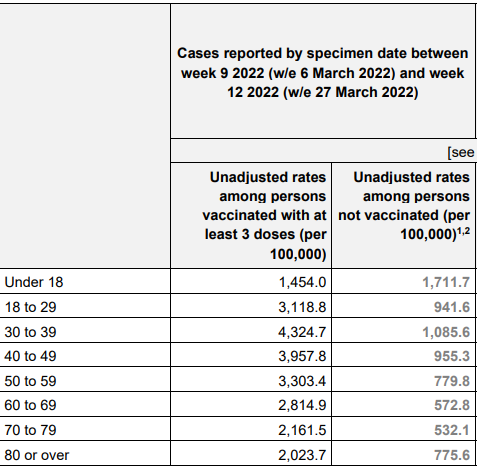
Starting with case rates, this clearly has turned into a pandemic of the vaccinated. Whether or not the unvaccinated are getting more ill or dying more (I’ll discuss this below), infections are clearly being driven by the vaccinated. Boosted over 18s are 3-4 times as likely to be infected than unvaccinated individuals. As I’ve said before, you might have the best vaccine in the world but if you are more likely to get infected and transmit the virus because you’ve had it, it’s not really the best vaccine in the world, is it?
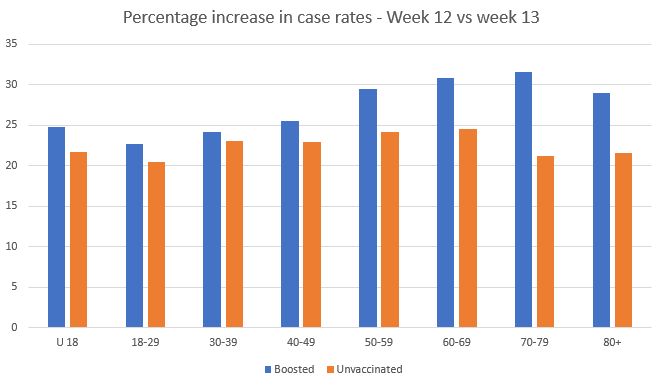
And whilst both boosted and unvaccinated case rates are increasing, it is clearly the boosted that are increasing the fastest (especially in the older groups).
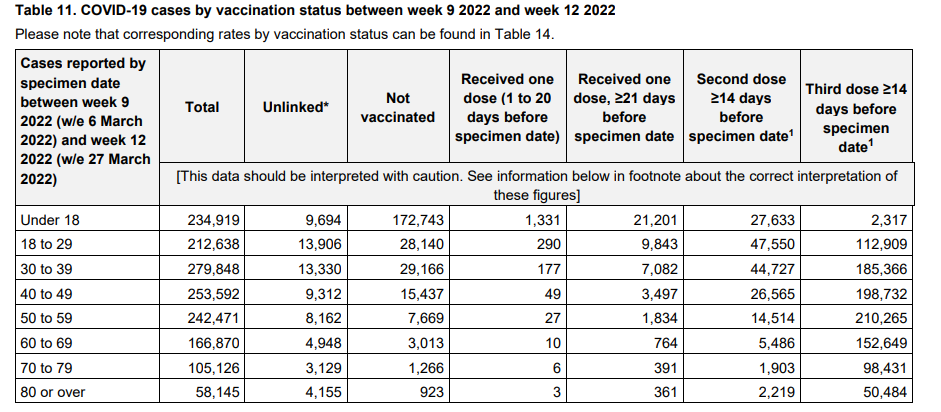
In terms of raw numbers, the boosted are again clearly driving the high case rates.
In total 16.6% of cases are in the unvaccinated with over 65% in the boosted. When compared with percentages of the population vaccinated we get this graph.
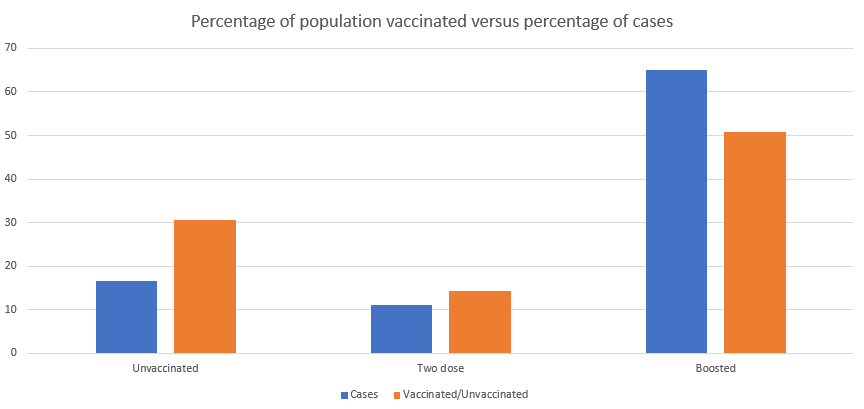
As you can see approximately 16% of cases are in the unvaccinated, however almost 30% of the population is unvaccinated. 11% of cases are in the two dosed group, with 14% of that population vaccinated and 65% of cases in the boosted with only 51% of the population in that group.
So on to hospitalisations.
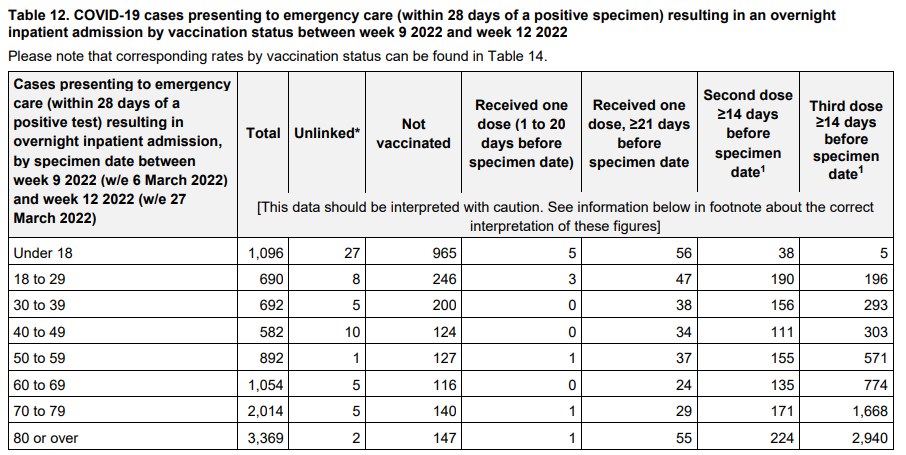
Almost 20% of the total hospitalisations are in the unvaccinated category, however as we’ve seen above, over 30% of the population is unvaccinated.
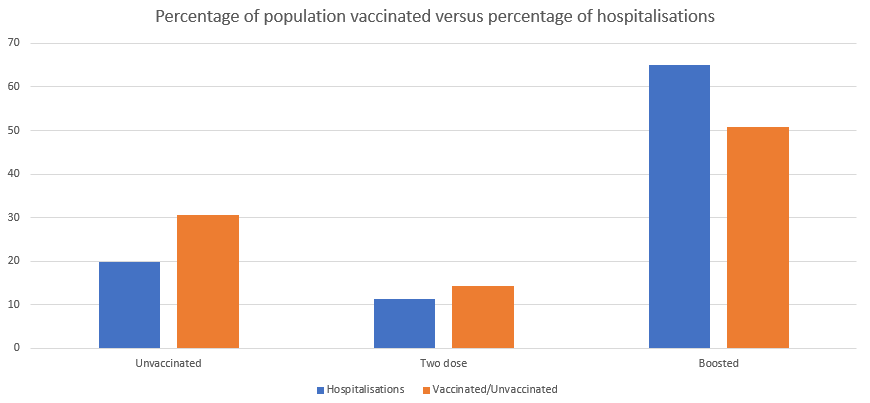
Again we get a graph like this with 19% unvaccinated hospitalisations versus a 30% population. Just over 11% of the two dosed group are part of the hospitalisation statistics versus 14% of the population and 65% of the total are boosted from 51% of the population.
Moving to deaths and the numbers skew even further.
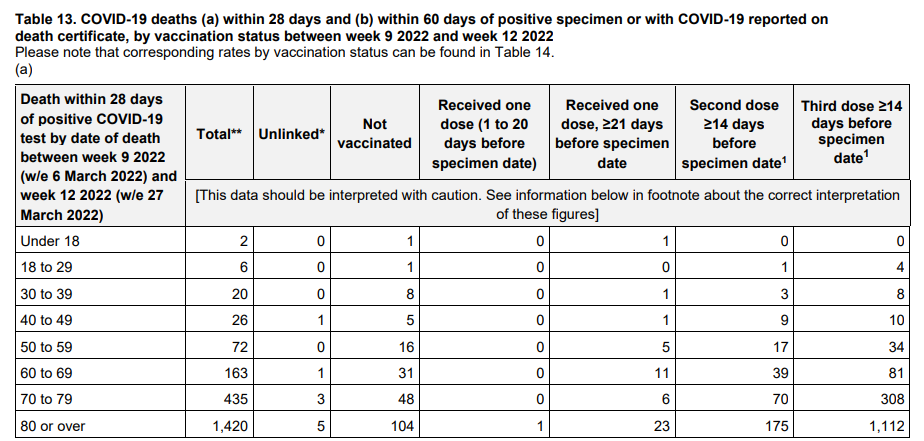
This time, less than 10% of the total amount of deaths are in the unvaccinated group.
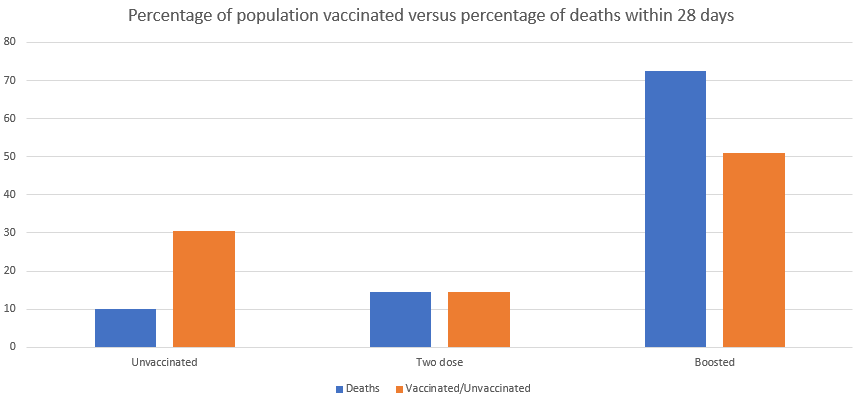
Here 10% of the total are unvaccinated from a population which is 30% unvaccinated. In the two dose group, the percentage of vaccinated and deaths are virtually the same at 14% but in the boosted 72% of the deaths are from this category whilst only 51% of the population are boosted.
Looking at the deaths within 60 days, it gets even worse.
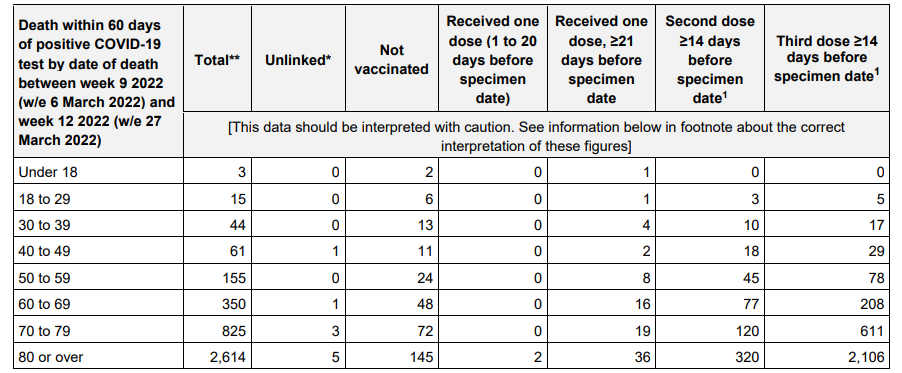
This time, under 8% of the deaths are from the unvaccinated group.
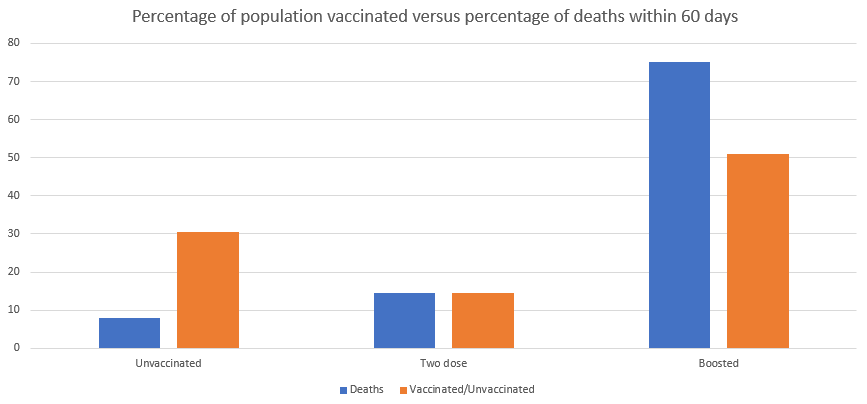
8% of deaths within 60 days are from the 30% unvaccinated population. Again the two dose group is almost identical but the boosted group comprises of over 75% of the deaths when only 51% of the population is boosted.
If we look at only the deaths between 28 days and 60 days the situation gets even worse still.
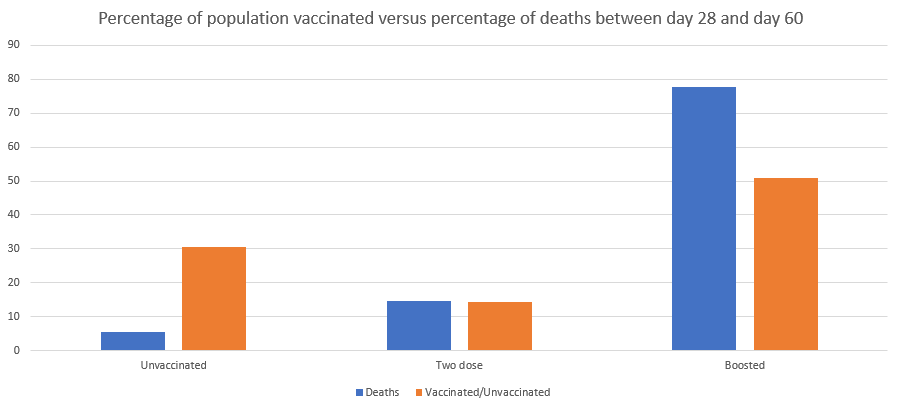
This time unvaccinated deaths represent 5.5% whilst boosted deaths are almost 78% of the total.
Some might argue that looking at the total amounts in the raw data is the wrong way to do it. Looking at the percentages when broken down by age does show that more unvaccinated are hospitalised and dying when compared with the size of the unvaccinated population.
However, this presents a different problem for the vaccines whereby people in the two dosed category are being hospitalised and dying at a higher rate, relative to their population, versus the unvaccinated.
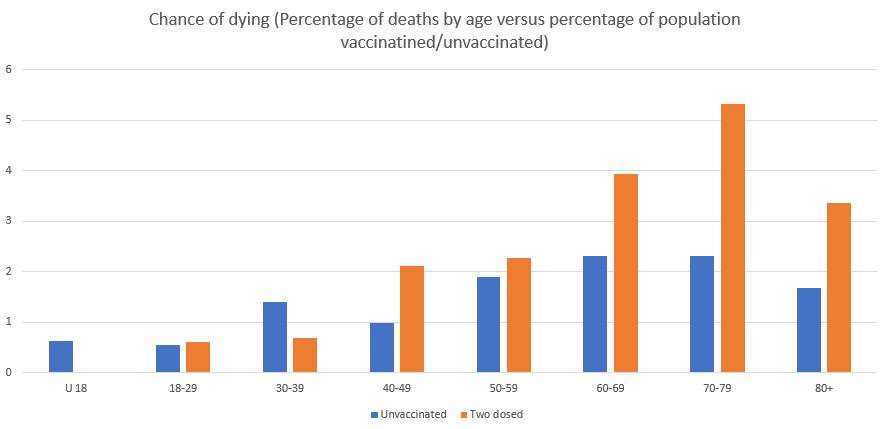
This graph compares the percentage of deaths versus percentage of that age group vaccinated or unvaccinated. So if 20% of the population were unvaccinated and 20% of the deaths in that age group were in the unvaccinated, the number would be 1. Below 1 means a small percentage of deaths occurred compared with the percentage vaccinated/ unvaccinated and above 1 means a larger percentage of deaths occurred. There are so few deaths in the younger age groups, these numbers can be ignored. However, in the older groups you can clearly see that the two dosed group dies at higher rates when compared with the unvaccinated.
To conclude, there is no doubt, however you look at it, cases and rates are much higher in the vaccinated than the unvaccinated. If the story ended there then I would still consider this a failure because more cases means more transmission, more hospitalisation and more deaths. Furthermore, more cases means more mutations occurring and in a highly vaccinated population, there will be an evolutionary pressure to mutate so as to be vaccine resistant.
When it comes to hospitalisations and deaths, again, however you look at it, something is wrong with what we are being told about the vaccines. If its high percentages in the boosted then is some kind of Antibody-Dependent Enhancement occurring? If its high percentages in the two dosed then is some king of Original Antigenic Sin occurring or have their immune systems become dysregulated?
I called the post (using the same photo as this article), from December, “Pandemics of the vaccinated” with an emphasis on the plural. Has mass vaccination prolonged the pandemic and meant more people continually catching Covid and more frequently? Something that should have been considered before vaccination and definitely something to keep investigating now.