Unless I seriously goofed, my survey is very convincing evidence that supports my position that the vaccines have killed over 500,000 Americans. It should be halted. Now.
By Steve Kirsch

Important note
This article hasn’t been pushed to my substack readers, only promoted on social media. If I made a mistake, please let me know in the comments so I can correct it before I publish it.
Executive summary
A simple survey of my readers provides extremely compelling evidence that the US government has killed over 500,000 previously healthy Americans.
The survey compared the all-cause mortality (ACM) death rates just PRIOR to a vaccine dose to the ACM death rates immediately AFTER the dose. I predicted they would be dramatically higher after the dose and the effect would be dose dependent. It appears I was right. In fact, the survey projects far more deaths than I thought possible.
I don’t think there is any way anyone is going to be able “explain away” these results once we re-do the survey with a better set of controls (the next step).
We found Dose #4 caused only a 1.27X increase compared with 5.5X to 8.3X for doses 1 and 2 respectively and 2.3X for Dose #3. If this were a highly biased population, Dose 4 would have caused a larger discrepancy, but it’s approaching 1:1 as we’d expect.
The decreasing ACM increase with later shots makes sense… the vaccine eliminates anyone whose immune system is susceptible to auto-immune attacks on the spike protein. If it hasn’t killed you after 3 shots, it’s less likely to kill you on shot #4. You’re immune due to both survivor bias and the fact that your immune system has recognized the vaccine as an invader and clears it from the system quicker than on shots 1 and 2. This of course says nothing about it’s impact on effectiveness against the virus which is likely pretty minimal at this point which is a story for another day.
When you do the math, based on these numbers, well over 500,000 people have been killed by the vaccines so far.
If the survey were more precise, I’d expect lower ACM increases, but still a final death toll north of 500,000.
The 500K excess death estimate is supported by the actual US mortality numbers as being plausible (which have a total excess death count of roughly 1M deaths since Jan 2021).
My colleagues are looking at this data and mulling over it, and we’re engaging a third party survey firm to validate it. So don’t break out the champagne just yet. But I think you’ll want to get it ready.
Introduction
I thought my May 13 survey would be important. I was right. I hit the jackpot on this one. Even if the effects are 100X smaller than what we found, it’s still 10X more than any reasonable stopping condition for a vaccine (>1 death per million vaccinated).
Everyone I know has reported more deaths after vaccination than the number of death right before they were going to be vaccinated. That’s impossible if the vaccines are safe.
If the vaccines are perfectly safe:
- The death rates immediately prior to any dose should be exactly the same as the death rate immediately after the dose.
- The death rate should be not be dose dependent. It should be 1:1 on every single dose (for the death rate before:after).
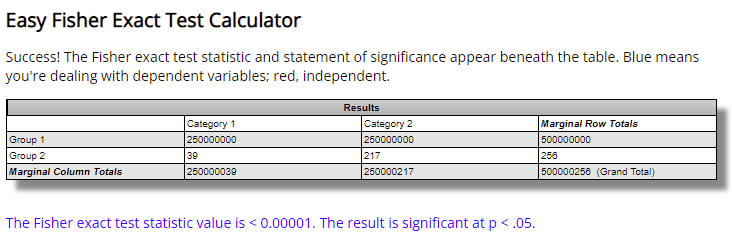
Guess what? Both of these “rules” are violated. Not by a little. By a lot. Like a factor of 5X to 8X increase in ACM in the month after the shot compared to the month before the shot according to 400 independent investigators.
And this is a VERY statistically significant result just 11 hours after I posted my Substack article.
The CDC had 18 months to do this sort of survey and still hasn’t done it. They probably never will.
It’s a valid study. It just needs to be re-done more carefully.
The data
You can download the data here. This is the first 400 form submissions. People may try to game the system after this point so subsequent data may be unreliable. But these first 400 responses were made under the radar and I have the email address of the person who submitted each row so that PolitiFact can verify every line. Of course, they won’t fact check me because if they verify it, it’s game over. Fact checkers can do their own survey and report the results. If they game the outcome, it will be very clear that they are not credible.
Eventually the NY Times will do the same survey and validate the results. It may be several years before they do that though.
The graphs
Here are the graphs so you can visualize the results:


. Number of responses: 386 responses.")
. Number of responses: 388 responses.")
. Number of responses: 374 responses.")
. Number of responses: 374 responses.")
The back of the envelope quick analysis
What this means is devastating to the safe and effective narrative.
It also DESTROYS the CDC argument that there is no link between vaccines and death. It would be hard for them to explain this away: the ACM effect is huge, it is statistically significant, and it is dosed dependent.
So let’s do the math. I’m just going to use round numbers because this is just an estimate. To do it right, we’d stratify by age, but we’re going to use average death rates, etc.
Around 3M people die a year in the US which is roughly a 0.86% death rate.
They don’t die evenly throughout the year, so like I said, this is just a rough estimate just to find the ballpark number.
According to Google (which uses Our World in Data):
250M got dose 1. The monthly death rate is 250M/12*.0086 = 179K. So if ACM is elevated to 5X normal, we’d expect 4*179K= 716K excess deaths. Just from the dose 1 effect. Whoa! That’s way higher than I expected and higher than than the 610K available to us. So I believe our survey is overstating the effect.
220M got dose 2. So we’d do the same math as before. Our spreadsheet shows a 8X normal death rate in the following month so (8-1)*(220/12*.0086)= 1.1M excess deaths.
100M got booster which shows a 2.3X increase so (2.3-1)*(100/12*.0086)=93K excess deaths.
So based on our very simple survey, we’d predict the vaccines caused 1.9M excess deaths total so far due to the all-cause mortality impacts. Whoa. I wasn’t expecting that. That seems way too high. We can’t see that in the CDC or Medicare numbers and those look consistent with each other. The most we can find is 1M excess deaths. So this is 2X too high.
Our VAERS excess death estimate used 12,000 US deaths in VAERS (subtracting out background deaths)*41 (the URF) = 492,000 estimated excess deaths caused by the vaccine. But the VAERS estimate should be conservative since the URF was calculated for the “very best case” event, so any practical URF should be higher than 41. So we have consistency in our prediction (the VAERS estimate is a minimum).
If our calculations are right, it would mean 40% of all deaths (1.9/(1.9+2.8)) are from the vaccine. What is interesting is that we’ve talked to embalmers who are seeing well over 60% of the deaths they do have these strange clots, only found in vaccinated people, that likely precipitated the death. So our survey is actually very consistent with the embalmer data; in fact we undershoot that data point. If we go lower, how do we explain the high rate of these telltale clots.
Hmmm…. something isn’t right.
In situations like this, it is best to be conservative and believe that we are overshooting the target here and our data is biased which we expected might happen.
Limitation: Biases
There are a couple of obvious biases in this survey:
- The survey went to my followers who are “truth tellers” and therefore biased against the mainstream narrative
- You are much more likely to know that Uncle Max died a week AFTER his vaccine than a week BEFORE he was SUPPOSED to get his vaccine.
My readers could be more “attuned” to hearing about deaths AFTER the vax than BEFORE the vax.
The survey could be tweaked to limit the results to immediate family member to eliminate this “reach” bias.
And secondly, the survey should be taken of an unbiased list by a third-party survey organization.
I’m actually hoping correcting these biases will reduce the effect observed by a factor of 4X or more. That will make the results more believable.
But here’s the stunning thing…
Even if we got it wrong by 1,000X, the vaccine should still be halted for everyone NOW
Even if we are super biased and got it wrong by 1,000X and the “correct” number is just 2,000 deaths, that is FAR beyond the safety stopping condition of a vaccine which should be fewer than 1 person per million dosed according to Paul Offit who is a recognized authority on the matter. Which means our stopping condition is 250 deaths. 2,000 vaccine caused deaths is 8X the stopping condition.
Is the vaccine useful for those over 80? I seriously doubt it, but where is the risk benefit analysis to prove it? Until we have that, you cannot take the chance (especially since we have abundant very credible anecdotal data that the vaccines are a menace to the elderly).
Sanity check with the CDC ACM data
Someone could point out that the CDC January to March ACM numbers (or the more detailed weekly numbers here for 2020-2022 and here for 2014-2019) weren’t 5X higher than the normal monthly numbers.
But that’s to be expected since everyone didn’t get their first dose every month!! It was a one time event that would effectively boost the annual ACM by 1.3X (which is (11+5)/12 since 11 months we have 1 death and 1 month we have 5 deaths which is 5x a normal month).
So if Dose 1 elevates the total annual ACM by 1.3X, if Dose 1 is given over 6 months, we’d expect a given month to be elevated by 1.6X (since 12*1.3X = 6*1.6+6*1)
ACM in Jan 2020: 60K
ACM in Jan 2021: 87K
So it only went up 1.6X which is what we expected.
Sanity check with the Medicare ACM numbers
The CDC ACM numbers could be wrong. How would anyone even know?
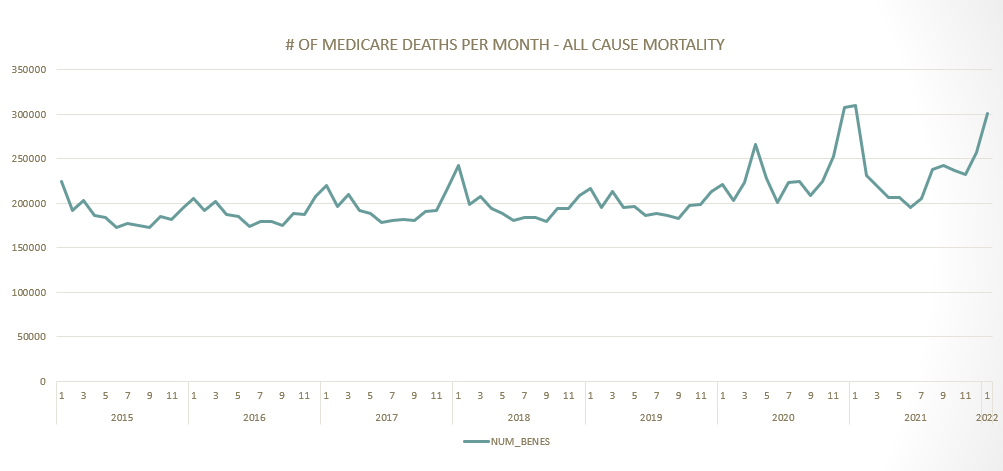
So let’s double check with the Medicare numbers. We have a friend on the inside who provided this graph.
We see ACM went up from around 200,000 per month to over 300,000 per month.
So that was a good sanity check on the CDC numbers that they went up just like the Medicare numbers did. Otherwise, we’d suspect that someone is cooking the books.
Sanity check with excess deaths
Let’s do a simple excess death calculation in 2019 vs. 2021 and 2022 to see how many excess deaths we’ve generated (approximately).
Using those CDC links, we compute the ACM for 2019 which we’ll use as our standard for simplicity (we are just trying to get a ballpark number here).
2019 ACM: 2,845,957 (baseline)
2019 ACM (first 7 weeks): 407,480
2021 ACM: 3,455,074
2022 ACM (first 7 weeks): 557,103
So approx excess ACM in 2021: 610K
Excess in 2022 (first 7 weeks): 150K
Extrapolate to week 19: 400K (this is because the CDC numbers aren’t fully baked the closer you get to the current date)
Total excess deaths: ~1M
Sanity check with Dose 1, 2, 3 timing
Because the numbers we so large, I didn’t do an analysis by timing, looking at the rollout number of each of the doses and comparing that to the excess deaths available to be claimed within a given month.
Once the numbers are more “in line” with the CDC death data, we can make those sanity checks.
Summary
Our estimate of 2M deaths seems way too high based on the CDC numbers, but too low based on the embalmer death data. But even if we got it wrong by a factor of 1,000 (which I doubt), the vaccines should be halted now. This survey shows causality and a number of deaths too large to ignore.