March 26, 2022 ( Health and Advisory Recovery Team)
Over 2,000 deaths in the vaccinated had been miscategorised as unvaccinated in the ONS deaths by vaccination status reports. These were people who had had a vaccine recorded electronically but never made it into the UKHSA dataset on who had been vaccinated (NIMS). There remains a large question mark over how many people were vaccinated but never had an electronic record, for example, because they could not be matched to an NHS number when at a vaccination centre.
Members of HART and others have previously published concerns around potential miscateogrisation of vaccinated deaths in the ONS dataset. A different picture is revealed when looking not at what is reported, but what is missing from the data. In fact, almost all deaths in the first two weeks after vaccination are apparently not included in the ONS dataset despite them claiming that their report includes all deaths from the point of injection onwards.
A full paper explaining how the missing two week’s of deaths was revealed is available here and it is summarised below.
The overall mortality rate for the population included in the ONS dataset is much lower than the expected based on the mortality rate for the whole population. This is not explained simply by the ONS sub-population being ‘healthier’ because the lower mortality is not consistent throughout the year. There is much lower mortality in each age group among the vaccinated at the very time the vaccine rollout is occurring which deserves an explanation.
A forensic analysis of the ONS dataset exposes that they may have excluded deaths that occured in the early weeks following vaccination. There is strong evidence that deaths that should have been included in the dataset have been omitted and that this omission is systematic rather than random. If a death occurred in the first two weeks after vaccination it does not appear to have been counted. The dataset is therefore corrupted, making any inferences about vaccine efficacy or safety, reliant on the data, moot. The ONS should therefore publicly withdraw their dataset and any claims made by others that are based upon it should be retracted.
Summary:
Four key pieces of evidence point to a conclusion that the ONS omitted deaths that occurred within two weeks of vaccination:
- Mortality rate in the population excluded from the dataset is disproportionately high
The ONS dataset only represents a part of the population, based on those included in the ONS 2011 census in England and in the GP register. Comparing deaths in the ONS dataset with those in the population as a whole shows high numbers of deaths outside of the ONS dataset. The only explanation for the lower mortality rates in the ONS data is that: the sub-population outside of their data has an extremely high mortality rate, more than double those included in the data set, or deaths have been omitted from the ONS dataset, thus ‘pulling’ the mortality rate down.
- From the beginning of vaccine rollout the mortality rate is unusually low when compared to historical norms
Despite vaccinating those most at risk of dying, in hospitals, care homes and even hospices, the non-covid mortality rate for the vaccinated was significantly lower than for the unvaccinated population at the beginning of the vaccine rollout. For the 70-79 year old age group, the only people being vaccinated in January were those at highest risk of dying, yet the mortality rates were apparently higher in the unvaccinated than this small cohort of people prioritised for vaccination. Given there is no reason why the vaccines should reduce non-covid deaths, the alternative explanations are that deaths must have been omitted from the ONS dataset or miscategorised (for example by administrators not recording vaccination in the recently deceased).
- Non-covid deaths are implausibly low for the group within 21 days of vaccination
The ONS dataset fails to include non-covid deaths that would be expected based on historical mortality rates. Only those non-covid deaths expected, based on historical mortality rates, in the third week after vaccination are included. However, deaths that would be expected to occur in the first two weeks have been omitted from the ONS dataset.
- Covid deaths are implausibly low for the group within 21 days of vaccination
In the first two months of 2021 the covid mortality rate was higher for those in the ‘more than 21 days after the first dose’ vaccination category than for those ‘within 21 days of the first dose’ vaccination which is the reverse of what might be expected. Using the covid mortality rate for the population as a whole, the group ‘within 21 days’ of vaccination suffer too few covid deaths. The reported covid deaths approximate those that would be expected in the third week after vaccination alone.
Background
The ONS were under pressure to release a dataset of deaths after vaccination, most likely with the intent to reassure the public that vaccination had caused no harm. They first promised a release of this data in March but they did not release any data for 6 months, after which there have been updates in November and December.
A thorough investigation of the rise in mortality on vaccine rollout has been shown to be compatible with a data lag or data miscategorisation but not a “healthy vaccinee” effect. The latter was excluded for two reasons. Firstly, because the proportion of the unvaccinated population considered to be in poor health fell during the vaccination rollout and was low even once the unvaccinated population was only a small number. Secondly, the same spike in mortality in the unvaccinated was observed when only looking at deaths of those in poor health.
An analysis comparing those in the ONS dataset to the population, as a whole, has been undertaken. By combining data from other data sources, including ONS data on total weekly death numbers and from the UKHSA data on numbers vaccinated, the mortality pattern in the whole population of England can be estimated and compared against the ONS dataset. First, the ONS dataset can be compared to the UKHSA data on vaccinations and the differences uncovered can be used to estimate the size of the vaccinated population that has been excluded from the ONS dataset. Secondly, taking the difference between the deaths in the ONS dataset and the ONS publication for covid and non-covid deaths in England and Wales, scaled to the population of England only, gives an estimate of the total number of deaths excluded from the ONS dataset. Studying the death and population estimates excluded from the ONS dataset reveals a radically different mortality pattern than that provided by the ONS dataset in isolation. Details of the methods used are listed in the appendix.
Evidence that ONS omitted deaths occurring in the first 21 days after vaccination
- Mortality rate in the population excluded from the dataset is disproportionately high
The ONS dataset is a carefully selected sample of the whole population, but it can be compared with other mortality datasets published by the ONS for the whole population. It is therefore possible to compare the mortality rate for people included in the dataset with the rate for those not included in the dataset. When compared it is clear the reported mortality rate for those not included by the ONS is more than twice as high as for those included. The only explanations for this is that either deaths have been omitted from the dataset or the mortality rate is genuinely twice as high for the residual population not included in the ONS dataset. There is absolutely no reason to believe the latter. Hence, we must suspect the mortality data reported in the ONS dataset.
For the 80+ age group included in the ONS dataset up to 26th March, 1% of the population had a covid attributed death. Using other official data sources, total deaths as reported by the ONS and the total population as estimated by ONS, 2% of the English population, not included in the ONS dataset, had a covid attributed death. There is therefore a discrepancy of 100% on covid mortality between one set of official data sources and the others.
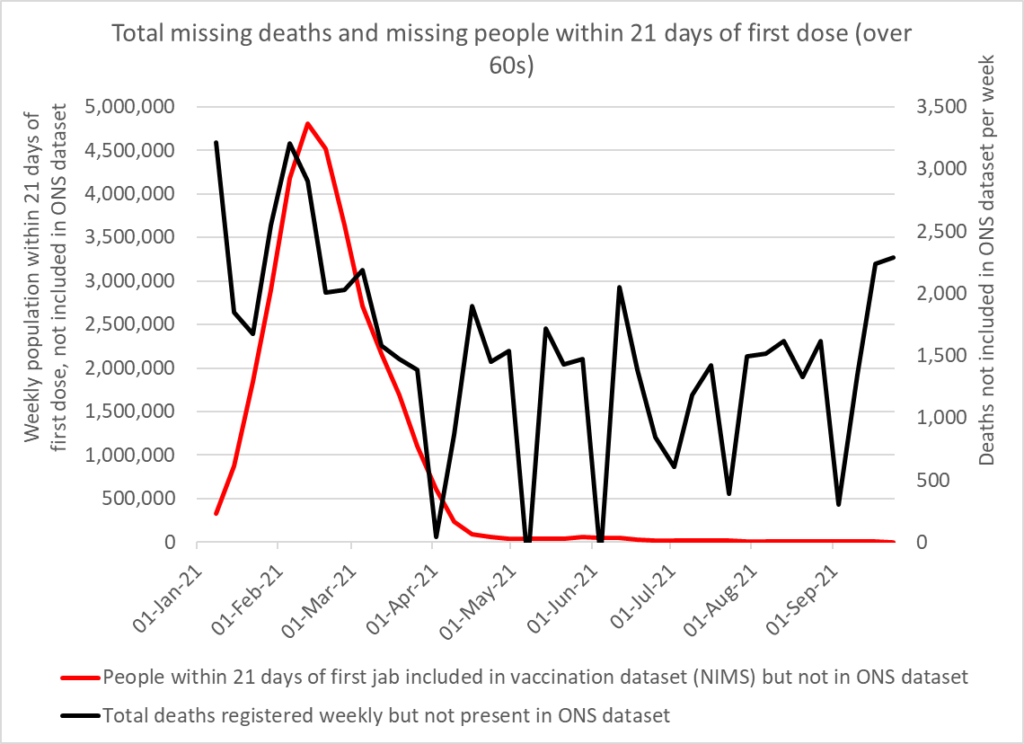
The total deaths included each week in the ONS dataset can be compared to the total registered deaths the ONS have reported for the whole population. The deaths not included in the ONS dataset occurred in the early weeks of the year, peaking at the beginning of February. A further comparison can be made between the whole population reported by UKHSA as belonging to the ‘within 21 days of a first dose’ vaccination category in the National Immunisation Management System (NIMS) and the numbers reported to be ‘within 21 days of a first dose’ in the ONS dataset. The population not included in the ONS dataset, belonging to the ‘within 21 days of a first dose’ group, correlates very closely with the deaths not included in the ONS dataset (figure 1).
- From the beginning of vaccine rollout the mortality rate is unusually low when compared to historical norms
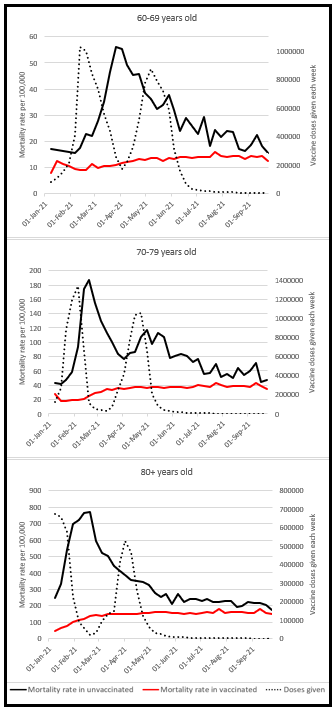
Vaccines were prioritised for those at most risk from covid: hospital in-patients, care home residents and even hospice residents. These people represent the fraction of the population with the highest mortality rate from both covid and non-covid causes. Therefore during the initial weeks the mortality rate in the vaccinated should have been significantly higher than that observed in the general population. However, in each of the age groups over 60, the mortality rate reported in the first few weeks after vaccination rollout was lower than expected (when compared with historical mortality rates) and far lower than that reported for the unvaccinated (see figure 2). For example, in the 70-79 year old age group, the mortality rate in the unvaccinated was twice as high as that for the vaccinated. No satisfactory and coherent explanation has been offered to account for this.
- Non-covid deaths are implausibly low for the group within 21 days of vaccination
Using historical mortality rates for 2015-2019 we can estimate how many non-covid deaths to expect as a proportion of the population by age. The number of people who were within ‘21 days of a first dose’ category changed over time but from the population data, included in the ONS dataset each week, an estimate of expected non-covid deaths can be calculated.
Surprisingly, the non-covid deaths reported by the ONS for the ‘within 21 days of first dose’ were between one third to a half of the number that would be expected using historical data. This difference is consistent across each age group.
| Expected non-covid deaths using historical data | Reported non-covid deaths included in the ONS dataset (prorated to England population) | |
| 60-69 | 3,246 | 1,106 |
| 70-79 | 7600 | 2,783 |
| 80+ | 16,331 | 7,514 |
Table 1: Total expected and reported non-covid deaths up to 26th March 2021 for the within 21 days of first dose vaccination category
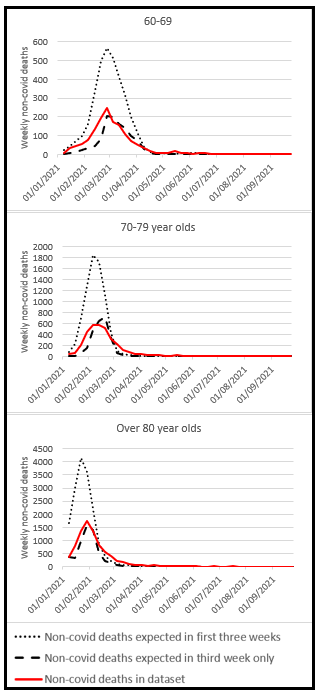
Figure 3 shows the weekly non-covid deaths reported in the ONS dataset for those in the ‘within 21 days of first dose’ category, the non-covid deaths expected for this in the same category as calculated from historical data, and the expected non-covid deaths occurring in the third week alone since first dose vaccination, as calculated from historical data. The proximity of the non-covid deaths reported in the ONS dataset to those expected to occur in the third week alone since first week alone since vaccination is remarkable. The same pattern occurs across each age category and is highly suggestive that the ONS dataset has not included the non-covid deaths that occurred during the first two weeks post first dose vaccination.
- Omitted covid deaths within 21 days
The vaccine ought to reduce the number of covid deaths but is not thought to be fully effective until two weeks have passed since vaccination. It has been reported that the vaccinated are vulnerable to covid infection during this period, therefore the covid mortality rate should be higher in the first 21 days after vaccination than the group more than 21 days after first vaccination. Yet, conversely, in the first two months of 2021, the covid mortality rate was higher for those more than 21 days after vaccination than those within 21 days of first vaccination.
The covid mortality rate in the population excluded from the ONS dataset can be estimated using a similar approach to that already used to estimate non-covid mortality, using the whole population covid mortality rate. This can be done for the ‘within 21 days of first dose’ category in each age group. The covid deaths included in the ONS dataset for those within 21 days of first dose vaccination are less than one third of that expected from the excluded data. This difference is consistent across each age group.
| Expected covid deaths within 21 days of vaccination | Reported covid deaths included in the ONS dataset (prorated to England population) | |
| 60-69 | 1096 | 205 |
| 70-79 | 3312 | 805 |
| 80+ | 9906 | 3157 |
Table 2: Total expected and reported covid deaths up to 26th March 2021 for people within 21 days of first dose
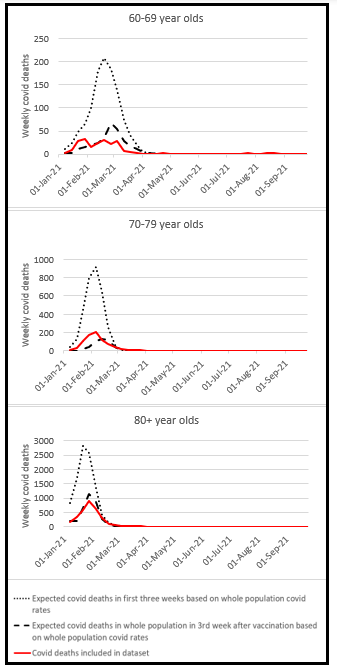
Figure 4 shows the weekly covid deaths reported in the ONS dataset for those in the ‘within 21 days of first dose’ category, the covid deaths expected for this in the same category as calculated from historical data, and the expected deaths occurring in the third week alone since first dose vaccination, as calculated from historical data. The proximity of the covid deaths reported in the ONS dataset to those expected to occur in the third week alone since first week alone since vaccination is remarkable. The same pattern occurs across each age category and further suggests the ONS dataset has not included the covid deaths that occurred during the first two weeks post first dose vaccination.
The fact that covid deaths occurring during the first two weeks have been omitted from the ONS dataset, in the same manner as non-covid deaths have been omitted is a significant and suspicious anomaly.
It could be argued that the 18 day average delay between diagnosis and death would mean that deaths within 21 days of vaccination might be explained by covid contracted prior to vaccination (it is recommended that vaccination should be postponed if covid positive). However, studies have reported significant numbers of covid infections occurring immediately after vaccination and given the period between infection and death is heavily age dependent, with a much shorter period in the over 60s, this explanation is not credible.
ONS explanation for the anomalies
The mortality rate is defined as the number of deaths divided by the size of the population, and therefore any inaccuracies in either the number of deaths or the size of the population will produce an inaccurate and misleading result.
The ONS dataset shows a spike in all-cause mortality in the unvaccinated that coincides with the first dose vaccine rollout for each age group (see figure 1 above). This higher mortality rate seen in the unvaccinated during the vaccination programme has been explained as being caused by these possible phenomena:
- There is a reporting lag such that deaths are reported a week late. The mortality rate would then be distorted by the shrinking population denominator in the unvaccinated group and the growing population denominator for the vaccinated.
- Post vaccination deaths have been miscategorised as unvaccinated.
- There is a “healthy vacinee” selection bias such that people who are mortally ill are not allowed or decline the offer of vaccination.
The December 2021 publication by the ONS supports the latter hypothesis and stated that:
The all-cause ASMRs for the year-to-date were lower in the first three weeks after a vaccine dose than in subsequent weeks after that dose. This could be because of a “healthy vaccinee effect” where people who are ill (either due to COVID-19 or another relevant illness) are likely to delay vaccination. Therefore, the people who have been recently vaccinated are, in the short term, in better health than the general population. The same is true for deaths involving COVID-19 after the second dose. This is likely because the healthy vaccinee effect where people who know or suspect they have COVID-19 delay vaccination until recovered, has a bigger effect here than the difference in protection offered by the vaccine within and following the first three weeks after vaccination.
However, the same report also states:
“Changes in non-COVID-19 mortality by vaccination status are largely driven by the changing composition of the vaccination status groups because of the prioritisation of clinically extremely vulnerable and people with underlying health conditions, and differences in timing of vaccination among people who were eligible.“
These points appear contradictory. If the extremely vulnerable were prioritised for vaccination, how can the clinically vulnerable disproportionately be over represented in the unvaccinated group?
The ONS hypothesis relies on two extreme and implausible assumptions:
- That a terminally ill person, when offered a safe and effective vaccine to reduce the risk of a distressing death from respiratory failure, would decline it;
- The dying, or their carers, can accurately assess their remaining life span and those with only two weeks left to live decline the vaccine. However, those with three weeks to live were vaccinated anyway and then died three weeks later.
The ONS hypothesis also does not fit with real world experience. There were numerous outbreaks of covid in nursing homes shortly after vaccination leading to many deaths. For example, in North East Scotland, Basingstoke, Cornwall, Corby, Renfrewshire.
Conclusion
The deaths reported in the ONS dataset are significantly lower than expected. There are lower numbers of both non-covid and covid deaths in the first two weeks after vaccination. Those non-covid deaths for the ‘within 21 days of first dose’ category included in the ONS dataset tally perfectly with the non-covid deaths that would be expected should they have occurred in the third week alone. Thus the two weeks of post first vaccination non-covid deaths appear to have been omitted from the ONS dataset. This pattern is repeated for the covid deaths occurring in the same ‘within 21 days of first dose’ vaccination category and again across all age groups.
Total deaths not included in the ONS dataset are disproportionately higher than that expected for the population excluded from the ONS dataset. This suggests deaths have been omitted from the ONS dataset. The fact that total deaths excluded from the ONS dataset correlates with the population of those in the ‘within 21 days of first dose’ vaccination category supports this assertion.
A variety of factors could have led to deaths in the first 14 days being omitted in the ONS dataset, including miscategorisation, reporting lags and recording, data handling or transcription errors. The dataset is therefore corrupted, making any inferences about vaccine efficacy or safety, reliant on the data, moot. The ONS should therefore publically withdraw their dataset and call for the retraction of any claims made by others that are based upon it.