New analysis of all-cause mortality data from Massachusetts, acquired through a FOIA, shows that only 6% of the 39k all-cause deaths (acd) in the first wave and 3% of the 48k acd have COVID19 listed as the main cause of death on the death certificate!
Even when just looking at COVID-19 deaths mentioned on the death certificate, it makes up 30% and 13% respectively for each wave.
NPI’s had little to no impact.
Analysis of unadulterated death certificate data from Massachusetts provides conclusive evidence for the tribunals.
By Joel Smalley
Throughout the COVID pandemic, we have been pleading for good quality data so uncompromised analysts like me can produce independent research as a counter narrative. This is the absolute essence of good science and evidence-based decision making.
Finally, as a result of an FOIA, we have access to seven full years of complete death certificate records for the state of Massachusetts, USA.
These are my insights.
Classifications
- SEPSIS
- CANCER
- NEURODEGENERATIVE DISEASES (Parkinson’s, Alzheimer’s, Dementia)
- CARDIOVASCULAR
- RESPIRATORY
- ORGAN FAILURE (Liver, kidney, gastrointestinal, multi-system organ failure, failure to thrive)
- MISADVENTURE (Drug overdose, hanging)
COVID-19
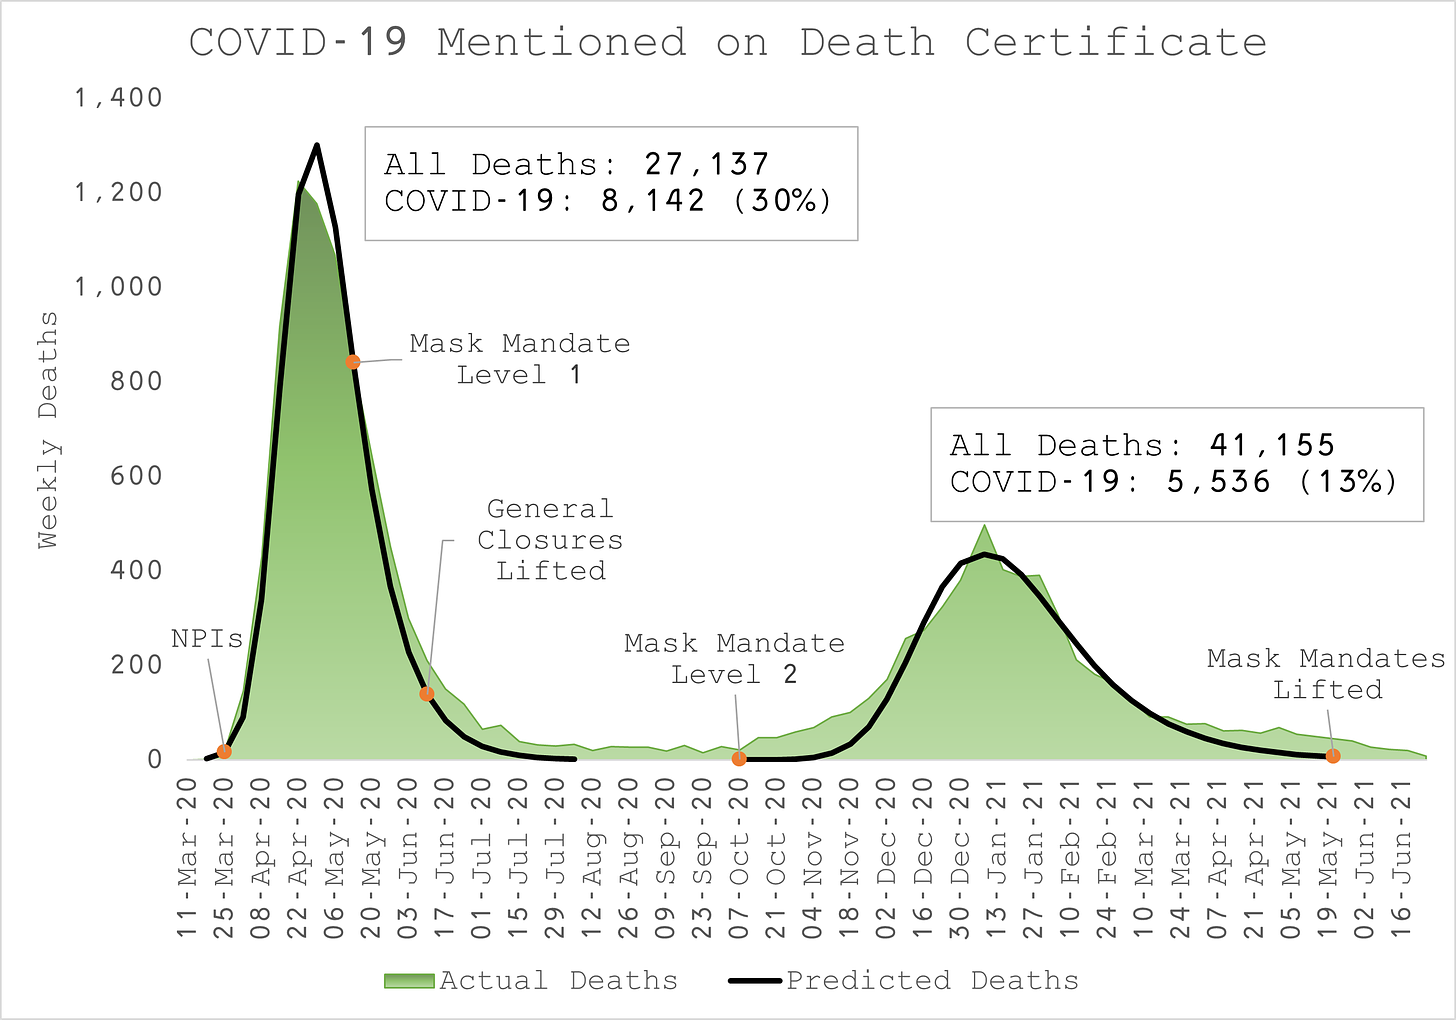
- COVID emerged in Massachusetts as a mortality event on 18-Mar-20 and was finished 17 weeks later on 15-Jul-20 (Figure 1). During that time, deaths where COVID-19 was mentioned on the death certificate (i.e. not necessarily the primary cause of death), represented 30% of all deaths.
- The state introduced a wide range of non-pharmaceutical interventions (NPIs) on 25-Mar-20, including general business closures (retail, bars and restaurants), and bans on gatherings. In theory, these NPIs should have caused the distribution of actual COVID-19 deaths to be smaller than the deaths predicted by a continuous mathematical function1 but evidently they are not. None of these NPIs had any impact whatsoever on COVID-19 mortality. All the death that was going to occur did occur.
- On 17-Apr-20, the state introduced a mandate for everyone to wear a mask when outside their home when other people were present. Since that mandate, the rate of decline of COVID-19 deaths actually slowed down rather than sped up which would have been the outcome if the policy were effective.
- On 10-Jun-20, the general closures were lifted. There was no apparent surge in COVID-19 deaths as predicted by the epidemiological models. In fact, the course of COVID-19 mortality continued its decline to zero due to natural causes (temporal herd immunity and seasonality).
- On 07-Oct-20, the mask mandate that had remained in effect was increased to include any time a person was outside their home regardless of location or the presence of other people. Immediately, at that time, COVID-19 mortality began to rise again. This is more likely to be a seasonal resurgence irrespective of the completely ineffectual mask mandate rather than because of it. This wave of COVID-19 mortality lasted for 32 weeks until 19-May-21 but there were 40% less deaths than the spring wave, representing 13% of all deaths during that period.
- On 19-May-21, the mask mandate was lifted but there was no subsequent resurgence in COVID-19 mortality which would be expected if the mask mandate had been effective. It is more likely that the COVID-19 outbreak ended again due to temporal herd immunity and seasonality.
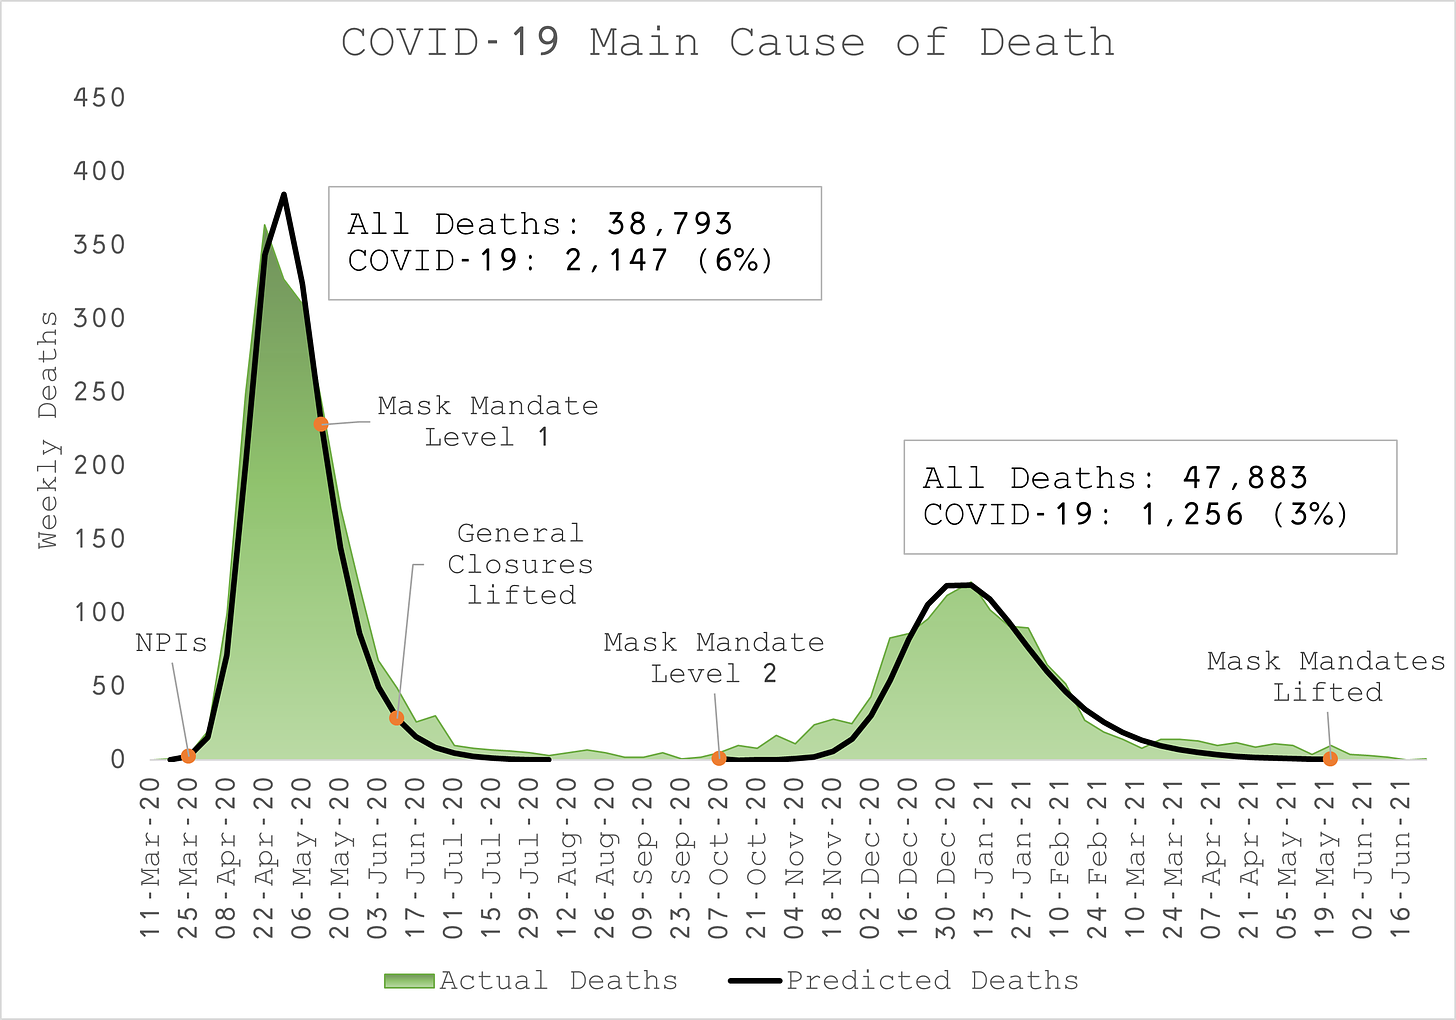
- The distribution of deaths where COVID-19 was attributed as the main cause follows the exact same pattern as that where COVID-19 was mentioned on the death certificate (Figure 2).
- Conversely, COVID-19 only represented 6% of all deaths during the spring epidemic and 3% during the seasonal return of autumn 2020 all the way through to spring 2021.
Deaths of Ages 5 to 11 Year Olds
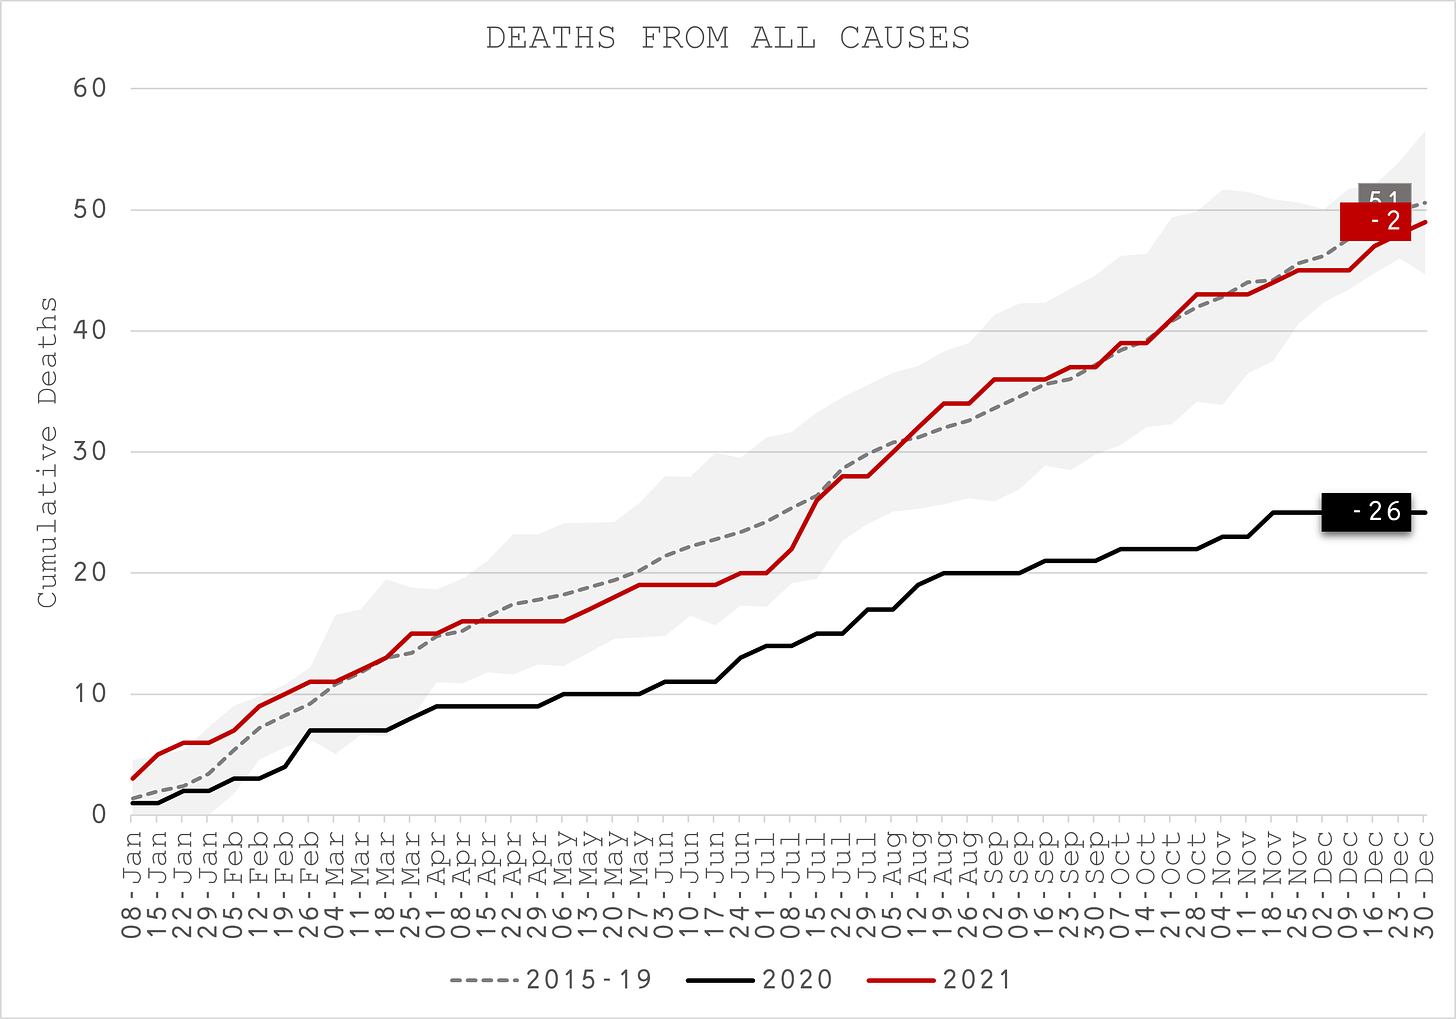
- During the pandemic year of 2020, deaths of children aged 5 to 11 were significantly lower than usual (compared to the 5-year average with a range of +/- two standard deviations from the mean). There were around half as many deaths as usual (Figure 3).
- During 2021, deaths were in line with expectations before breaking down in a similar fashion to 2020 between April and June. However, there was a sharp rise in deaths in July, returning deaths to their usual trajectory.
- There does not appear to be any single cause of this rise. Misadventure is the only category that ended the year above the upper bound of expectation with four deaths in total.
- There were no deaths at all due to COVID-19 in this age group and only one where COVID-19 was mentioned, i.e. the child died of something else but COVID-19 might have contributed to the death.
Deaths of 12 to 15 Year Olds
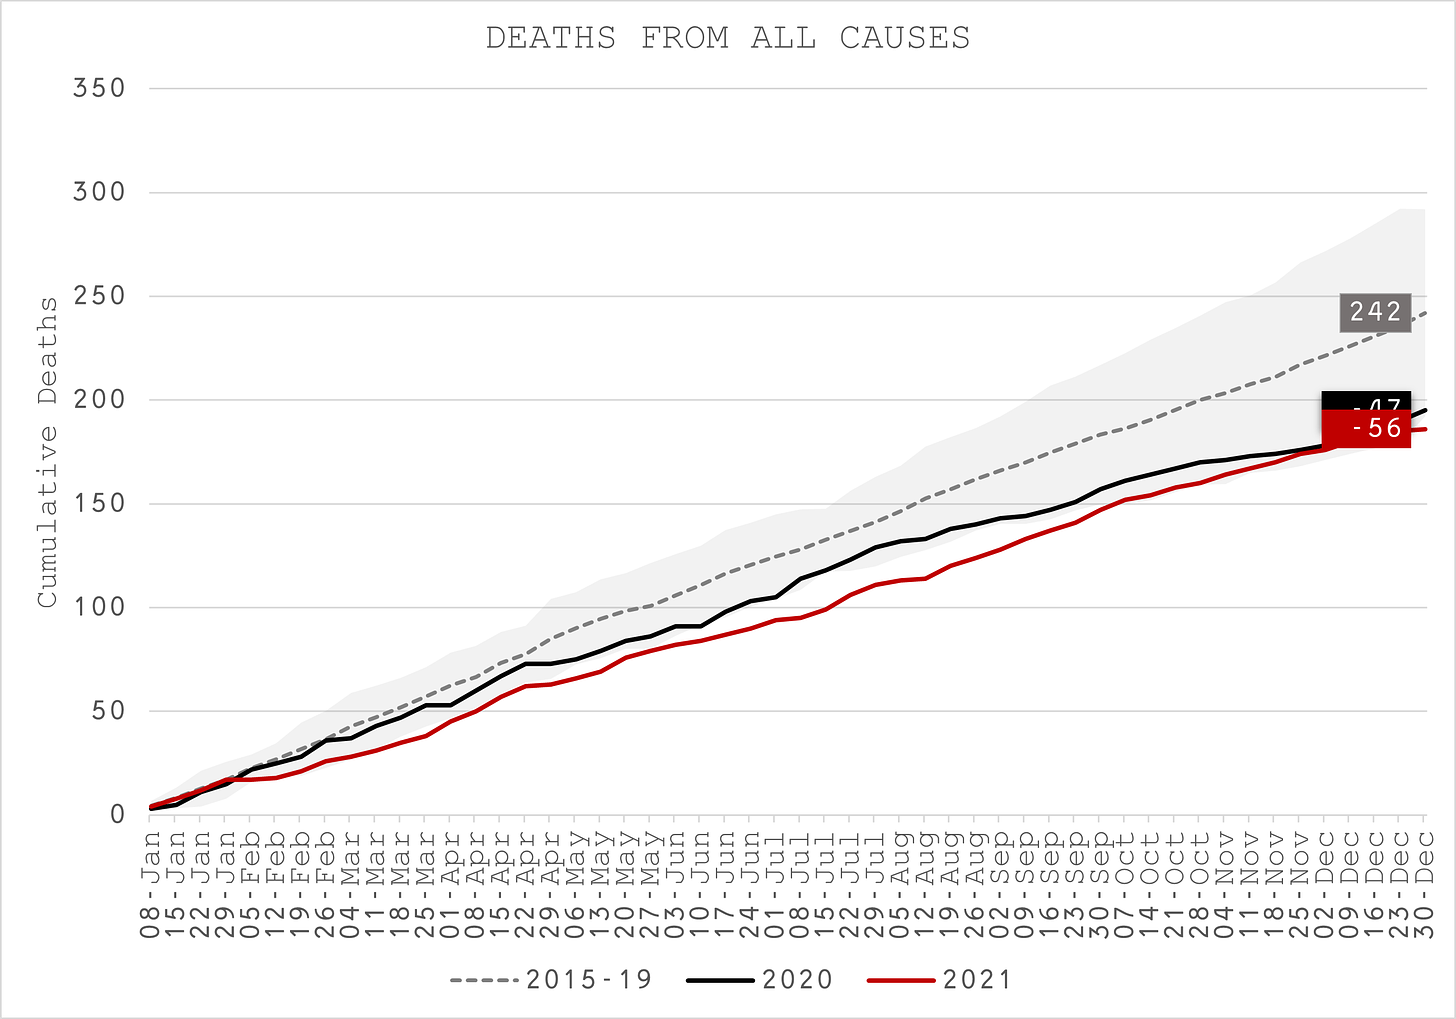
- During both 2020 and 2021, deaths of children aged 12 to 15 were significantly lower than usual with around 20% less deaths (Figure 4).
- However, misadventure is the only category that ended the year above the upper bound of expectation in 2020 with twelve deaths in total, twice as many as usual (Figure 5)
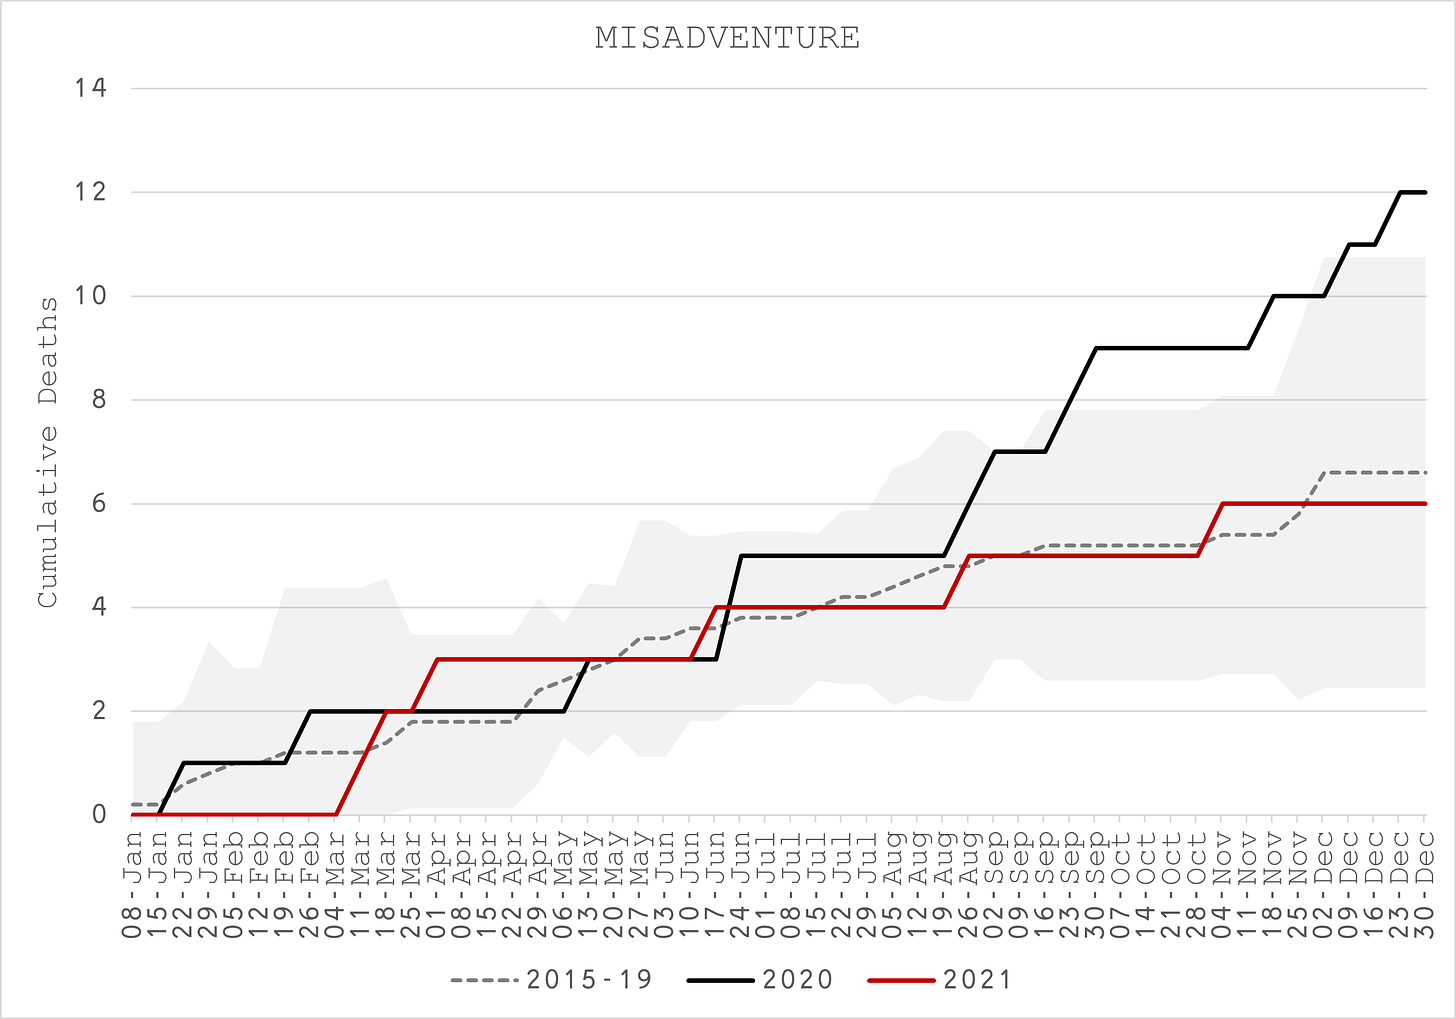
- There were no deaths at all due to COVID-19 in this age group but six where COVID-19 was mentioned.
Deaths of 16 to 19 Year Olds
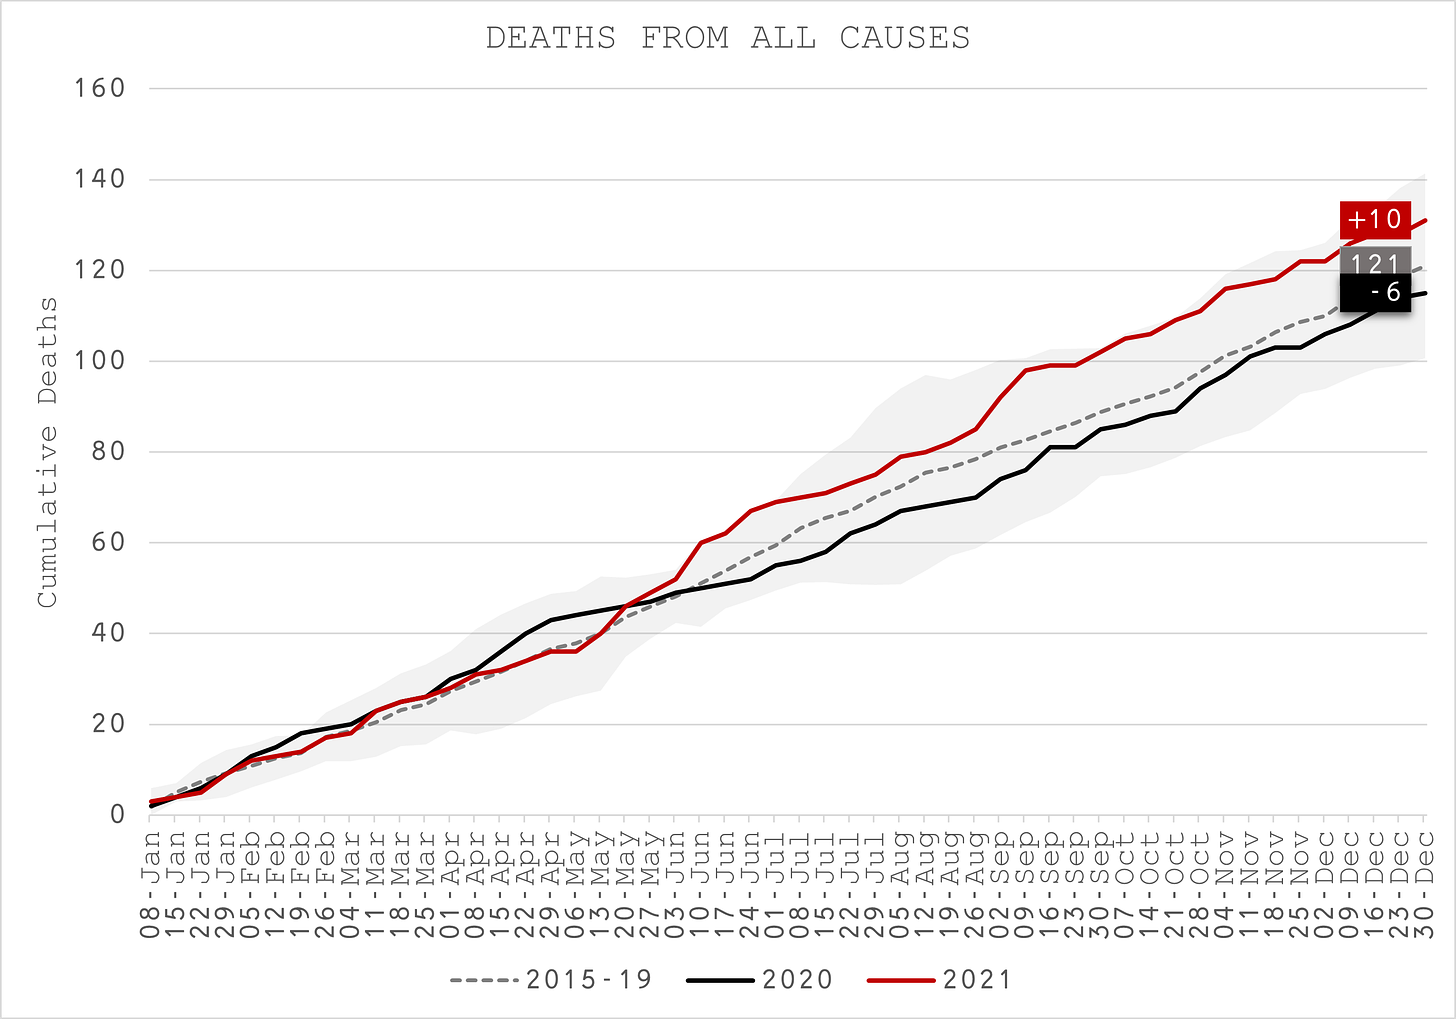
- During the pandemic year of 2020, deaths of teenagers aged 16 to 19 were more-or-less in line with expectations with an evident, albeit insignificant hump during the spring epidemic (Figure 6).
- During 2021, deaths were in line with expectations before breaking up in in mid-May, ending the year just over 8% higher than usual but just inside the upper boundary.
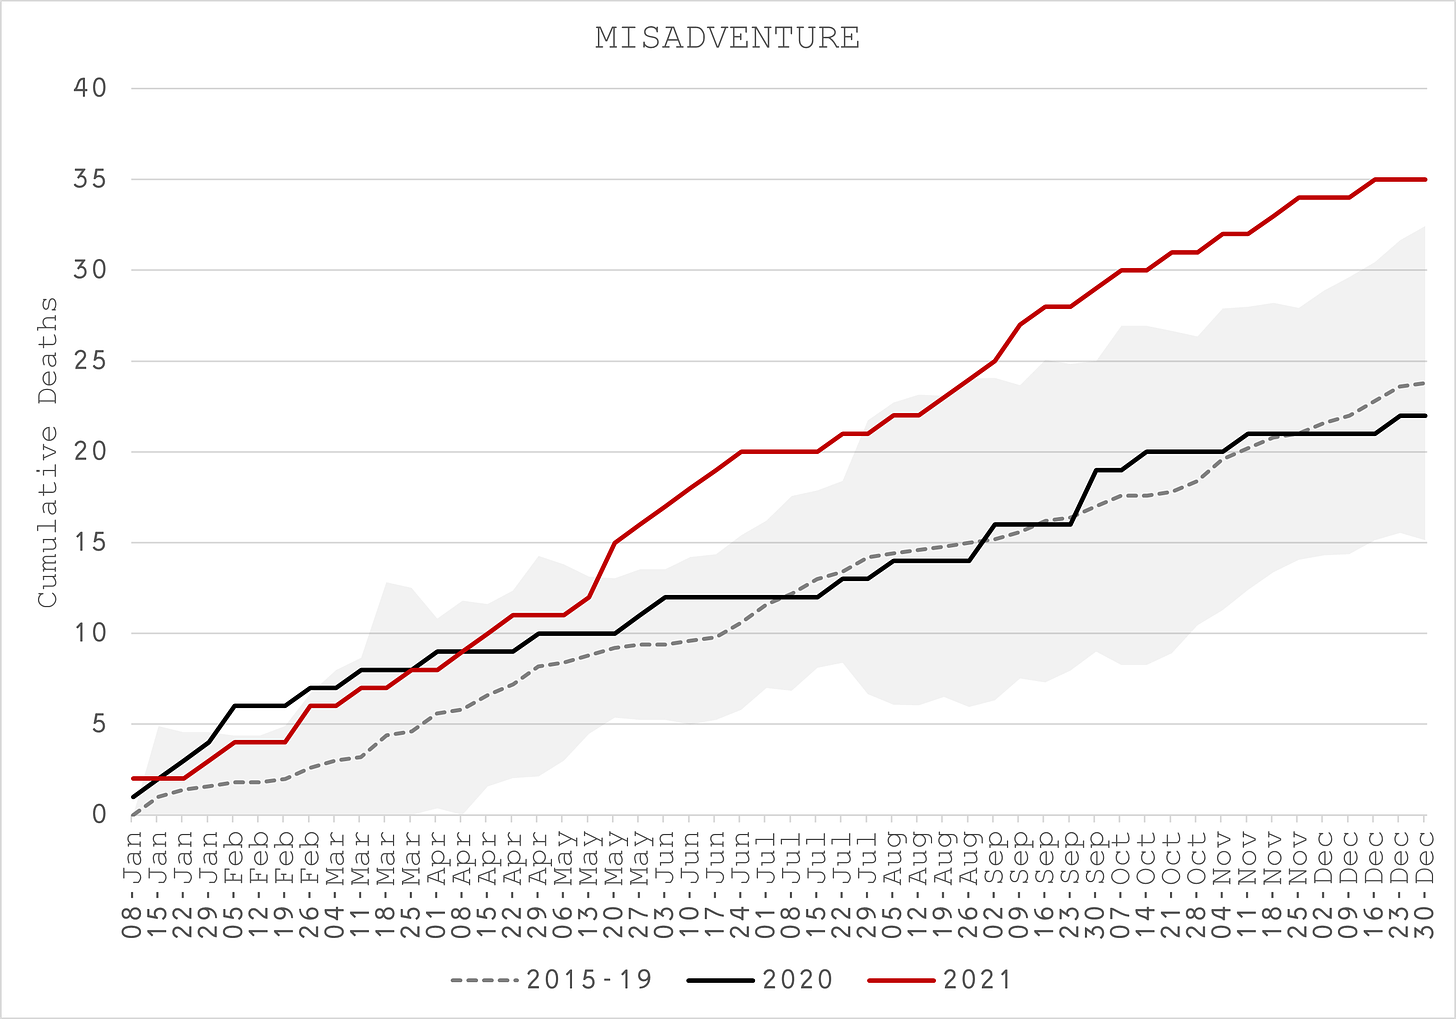
- Misadventure is once again the only category that ended the year above the upper bound of expectation with 35 deaths in total, 45% more than usual.
- There was just one death due to COVID-19 in this age group in 2021 but none in 2020, and 3 mentioned in 2020 compared to 5 in 2021 (Figure 7).
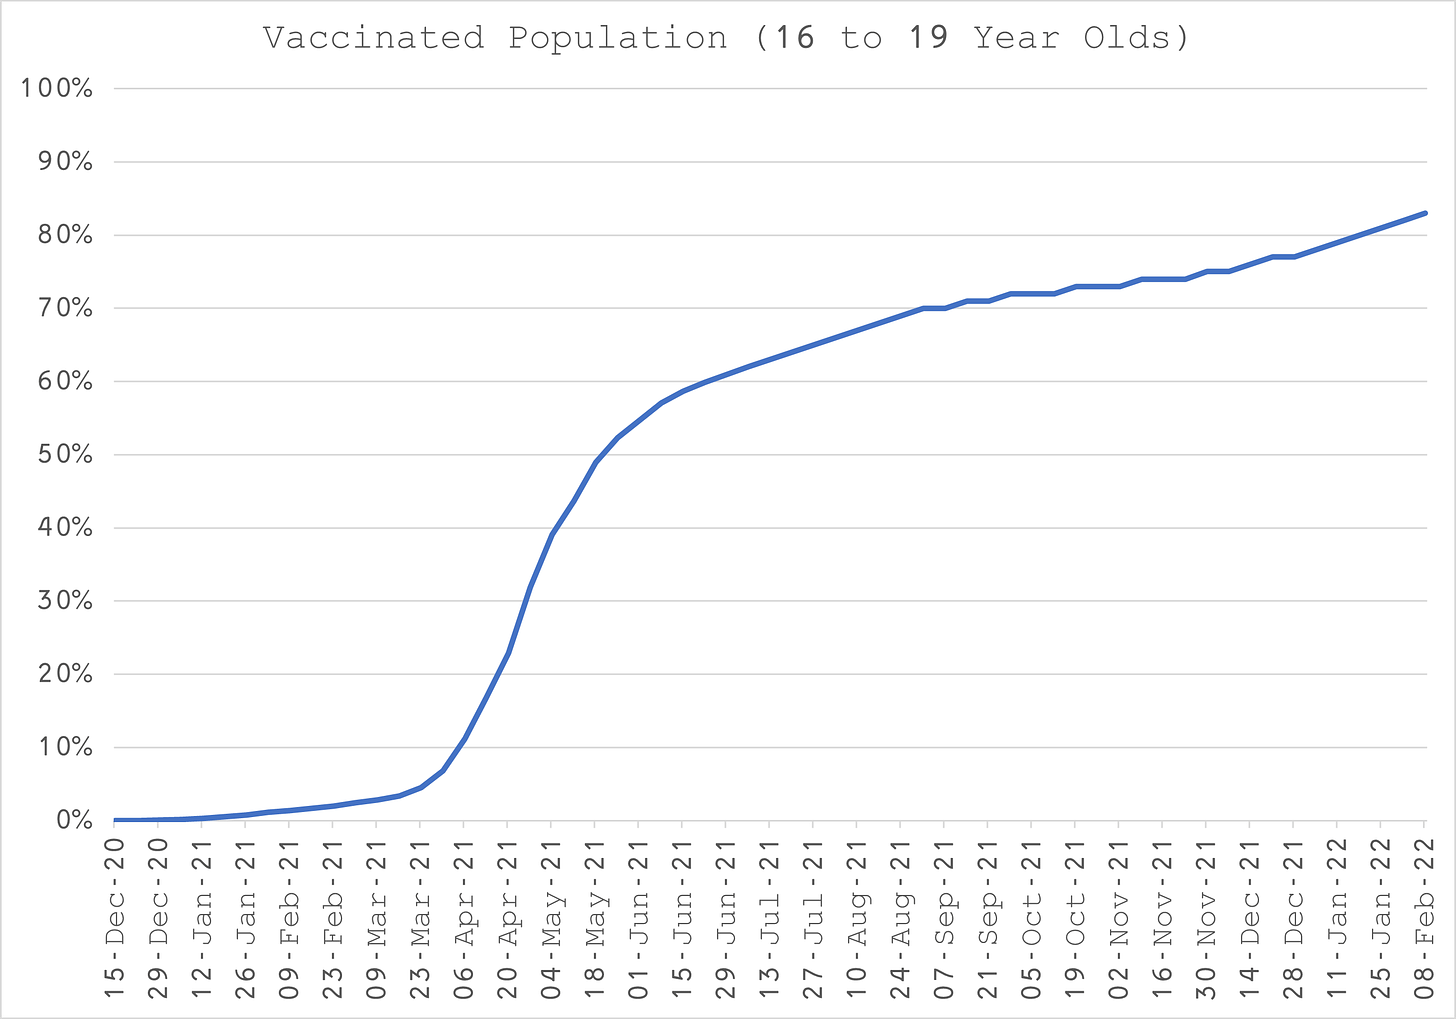
- The rise in deaths in 2021 also coincides with the middle of the main mass vaccination of this age group (Figure 8).
Deaths of 20 to 29 Year Olds
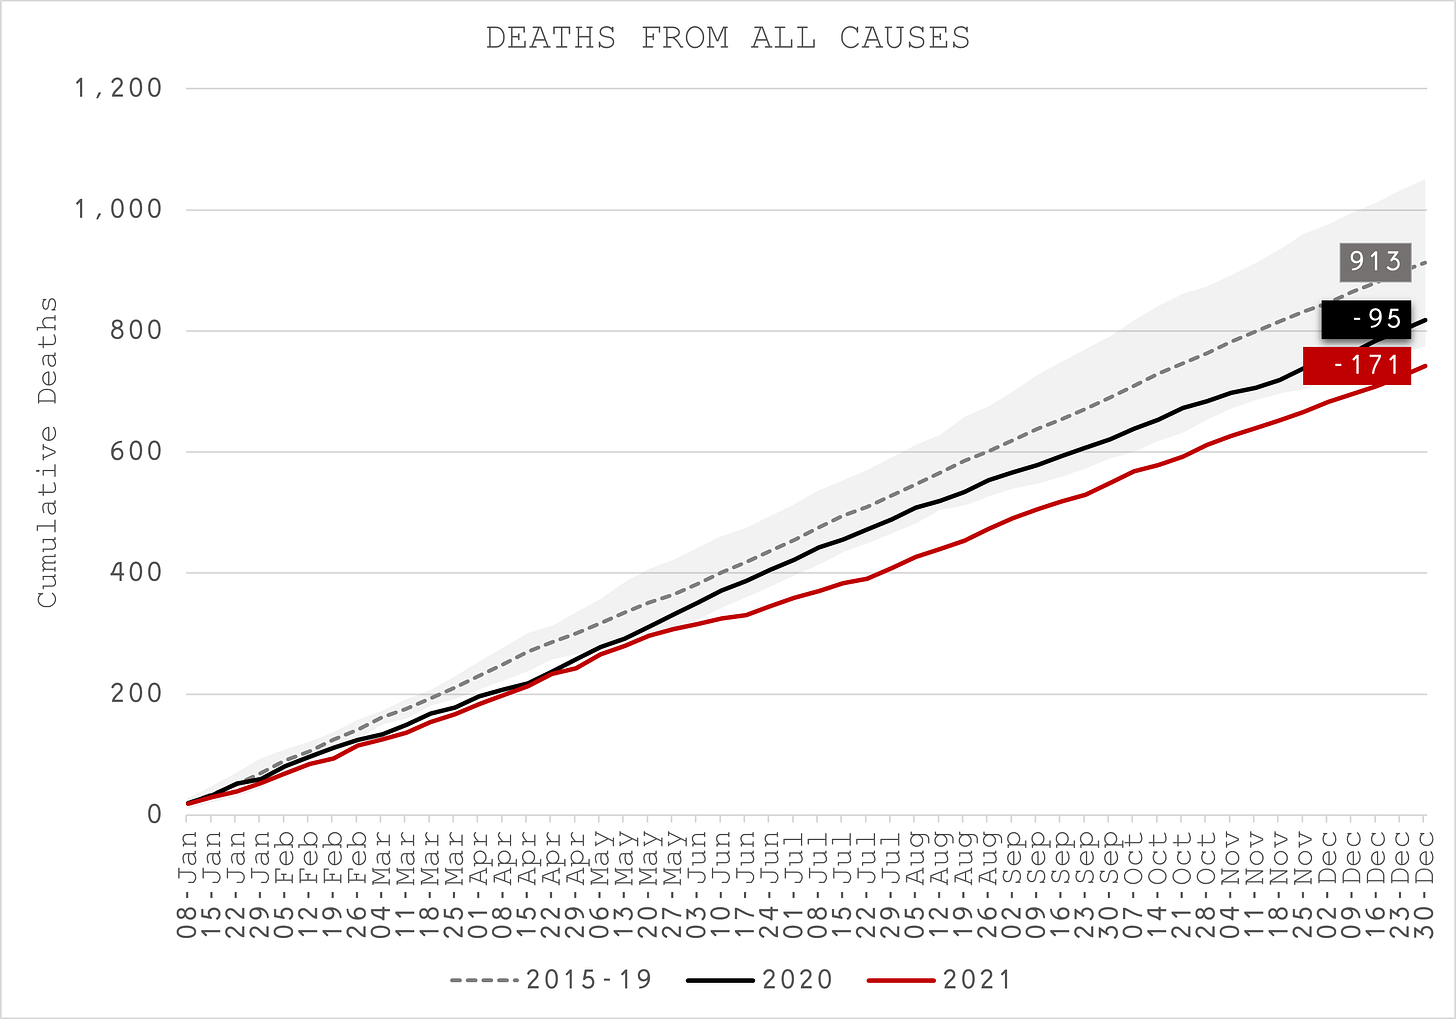
- Deaths of 20 to 29 Year Olds were 10% lower than usual in 2020 and almost 20% lower in 2021 (Figure 9).
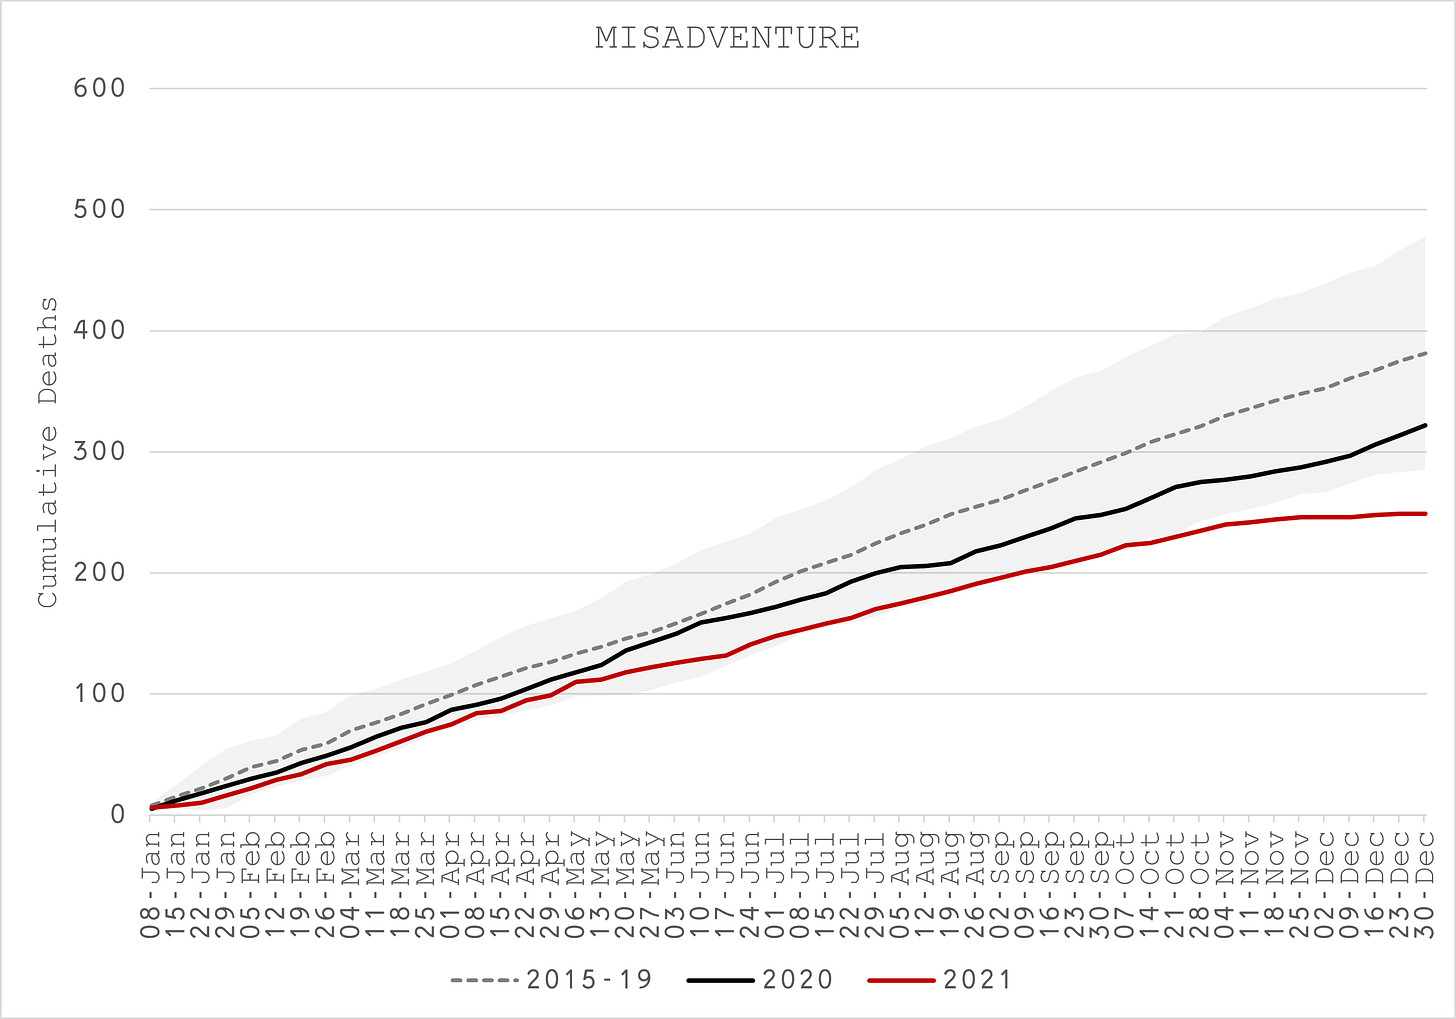
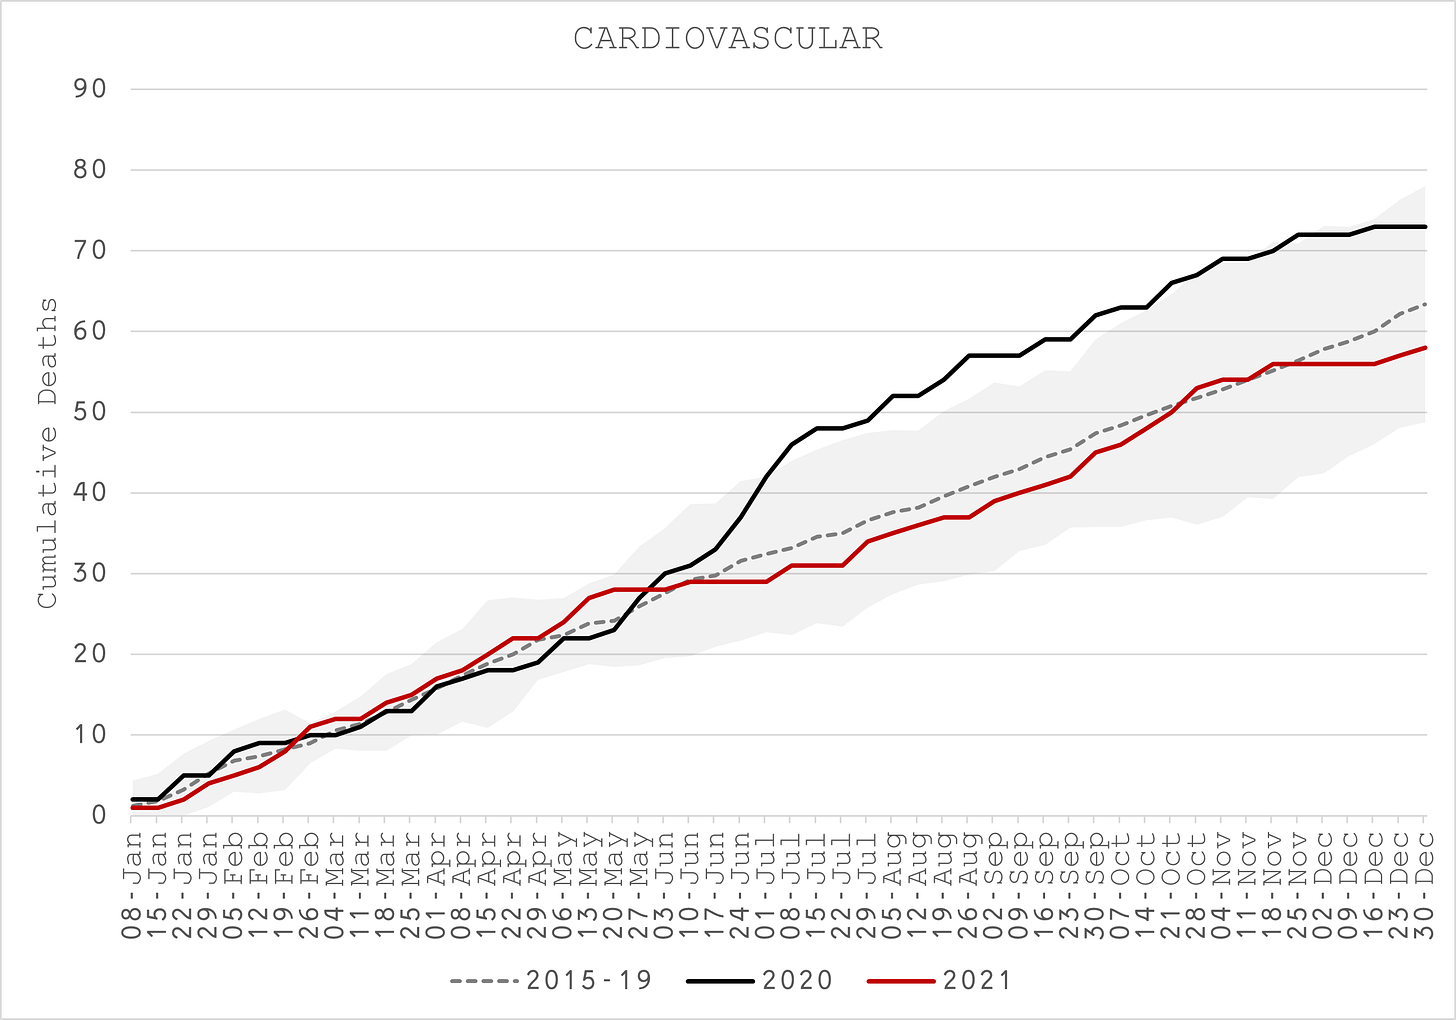
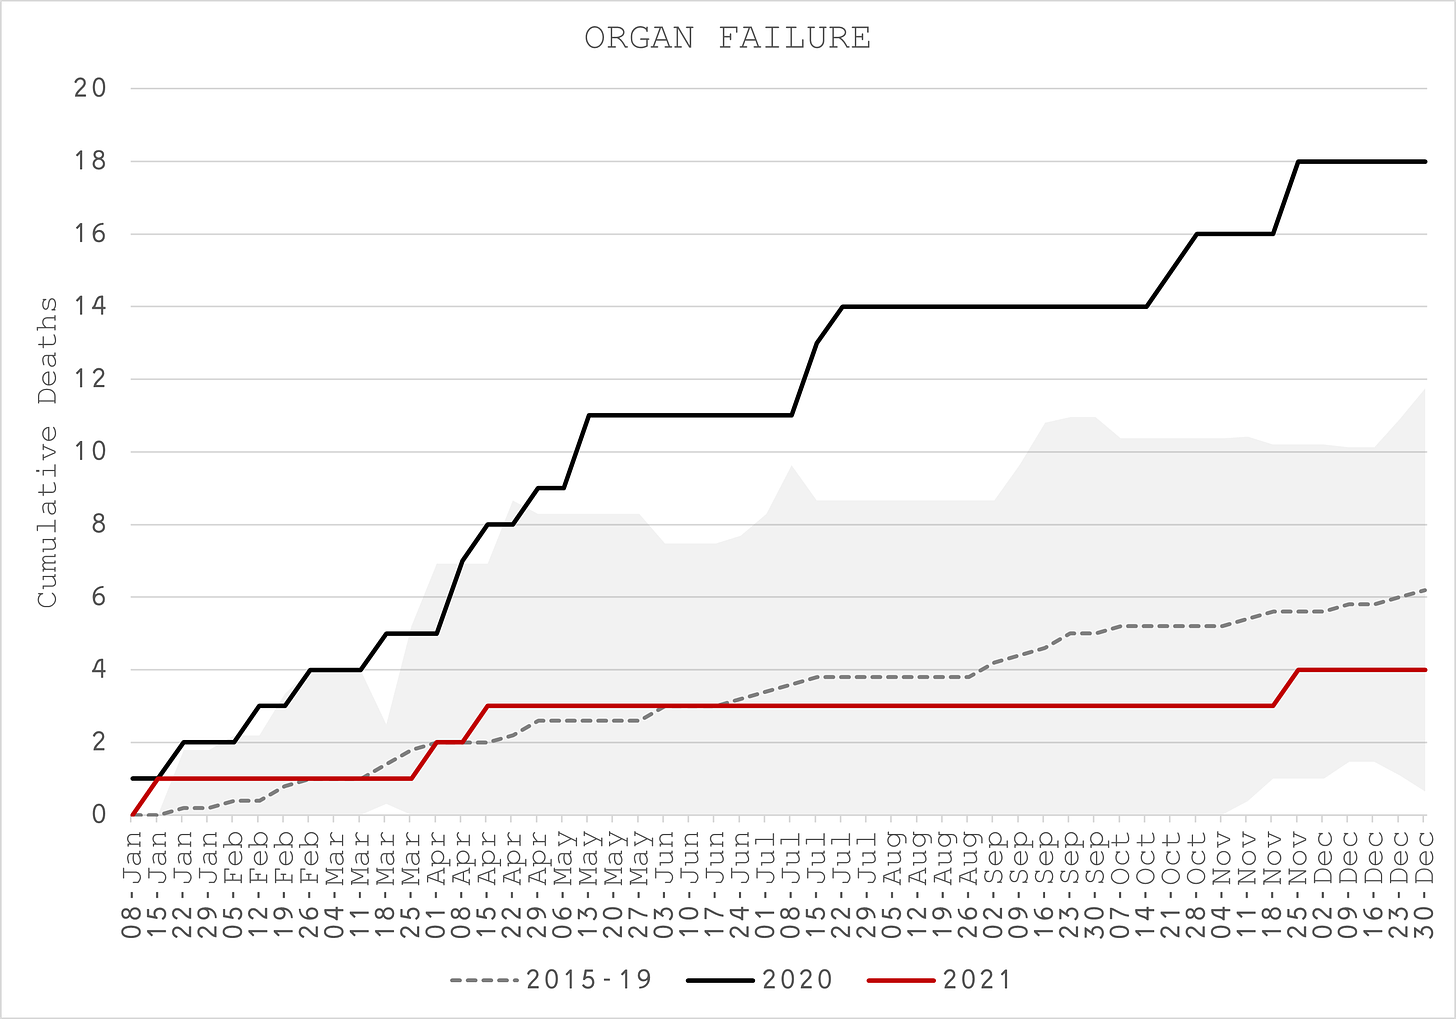
- However, this is mainly due to substantially lower deaths due to misadventure (Figure 10), offset by higher deaths in cardiovascular (Figure 11) and organ failure (Figure 12) in 2020. Note however, 2021 misadventure deaths look incomplete.
- There were four cases each year where COVID-19 was the primary cause of death, i.e around 0.5% of all deaths. However, it was mentioned 13 times in 2020 compared to 28 times (more than twice as often) in 2021 (Figure 13).
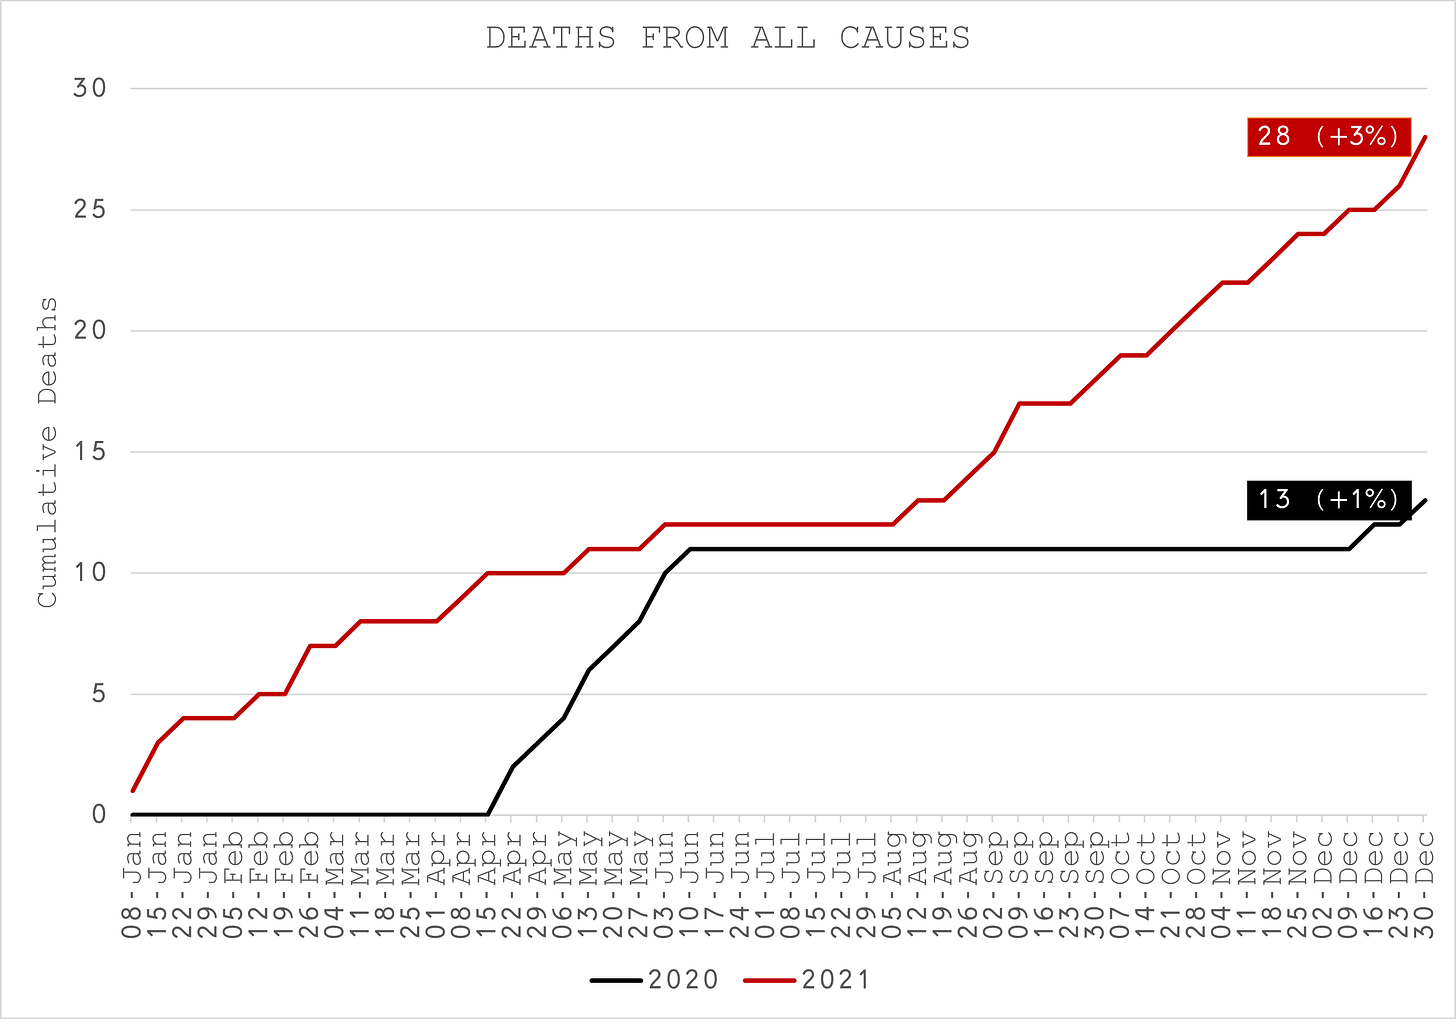
Deaths of 30 to 39 Year Olds
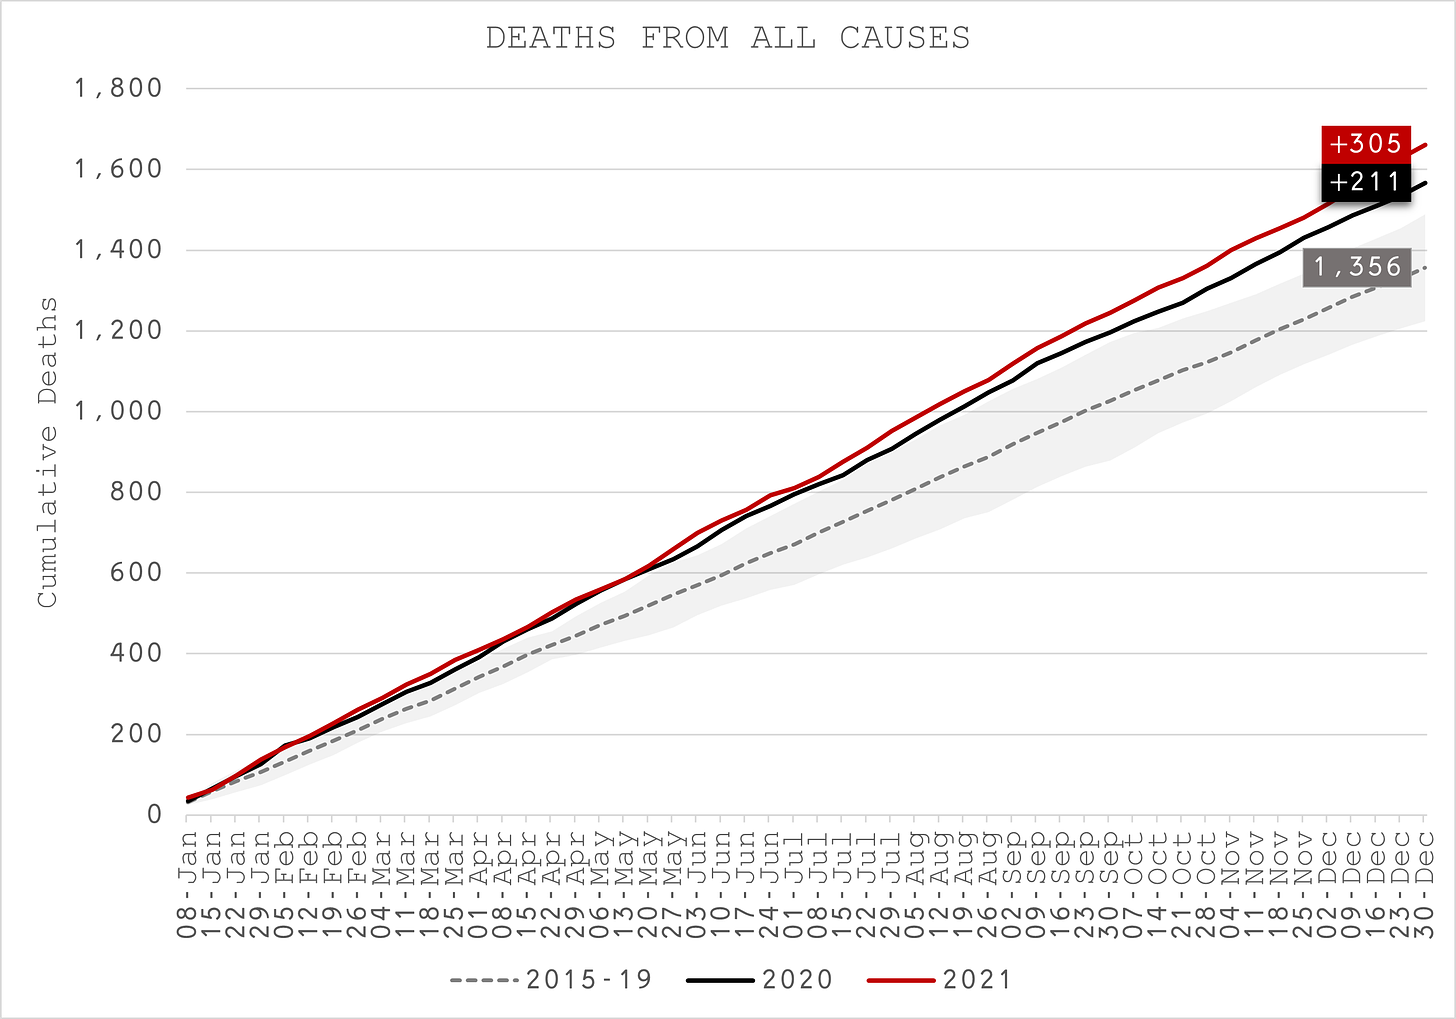
- Deaths of 30 to 39 Year Olds were 15% higher than usual in 2020, way outside the upper boundary and do not coincide with the COVID-19 outbreaks (Figure 14).
- In 2021, they were higher still at +22%.
- Organ failure deaths are higher than expected but the main culprits are cardiovascular (Figure 15) and respiratory (Figure 16).
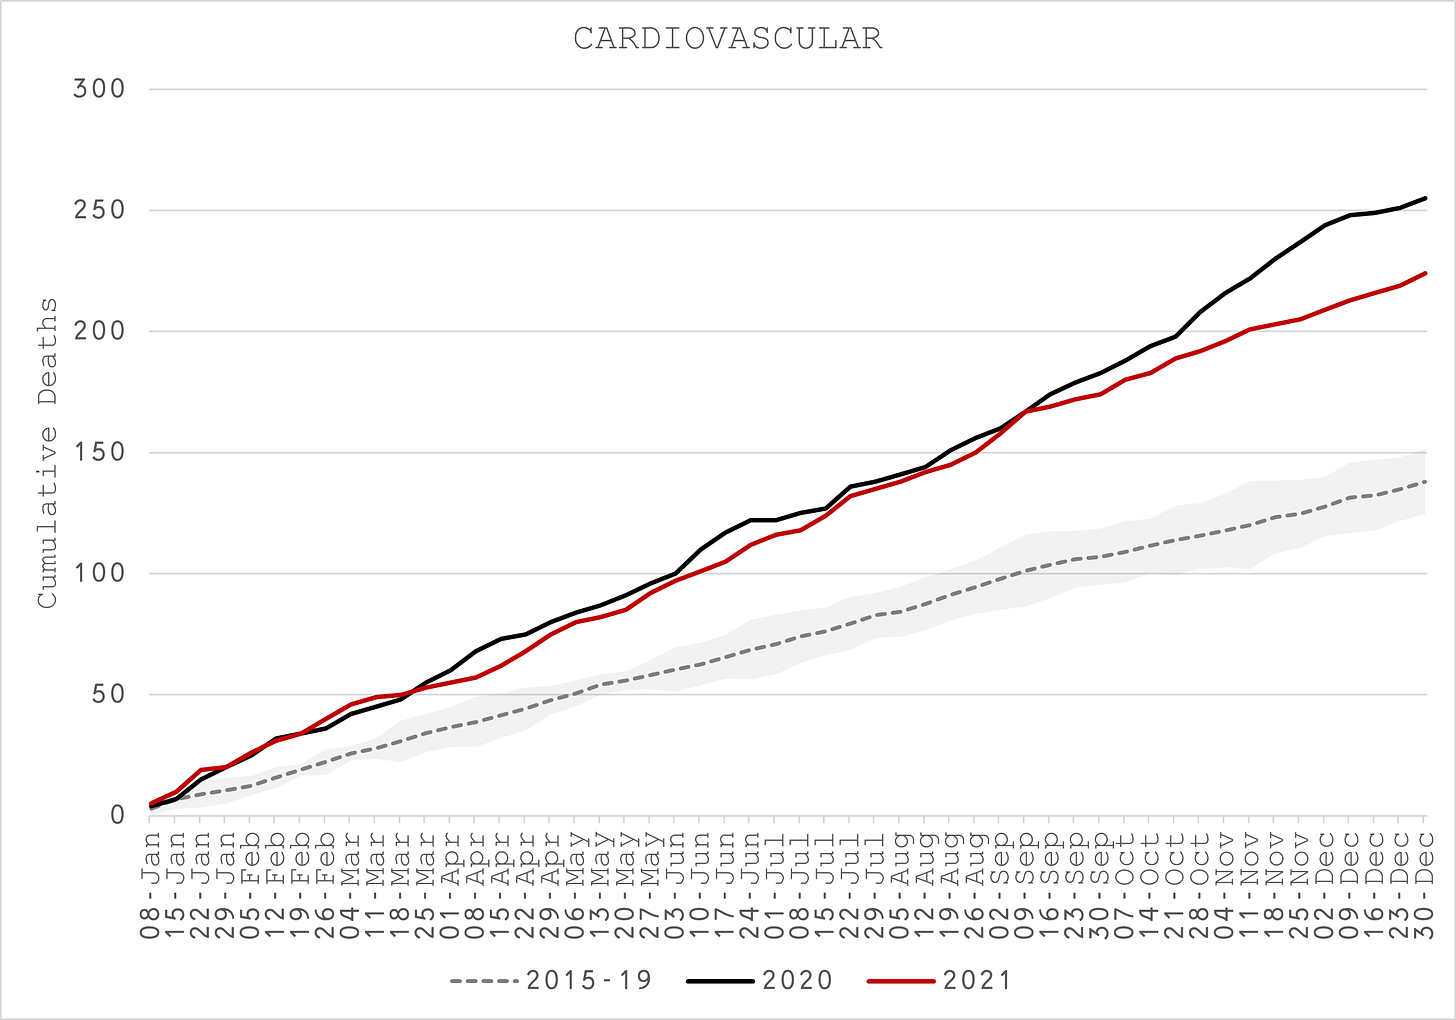
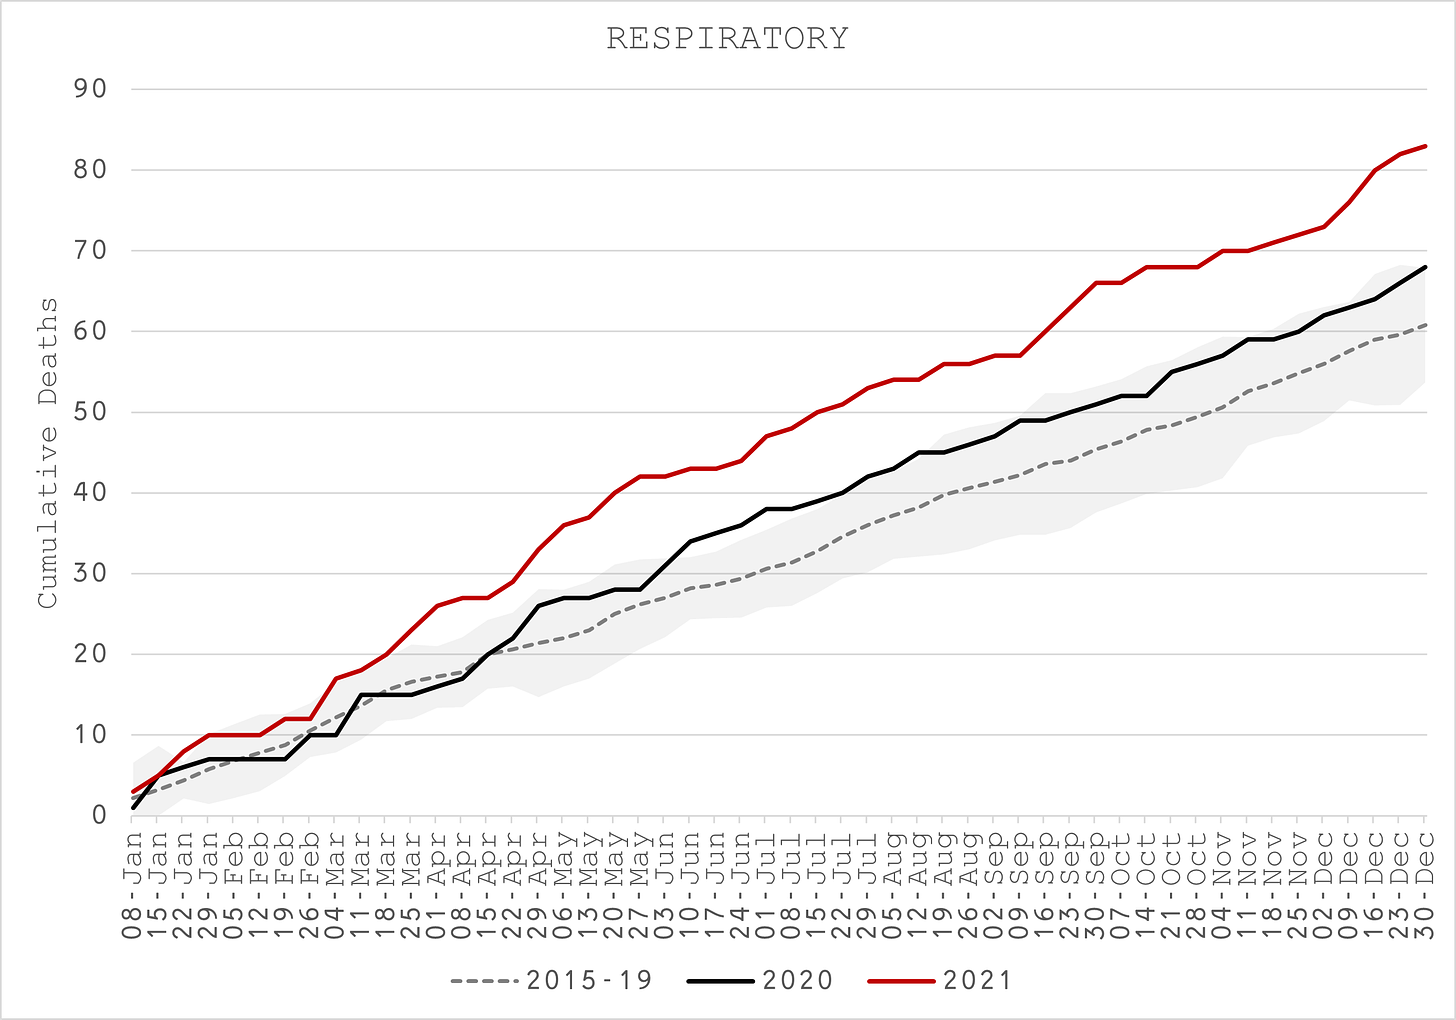
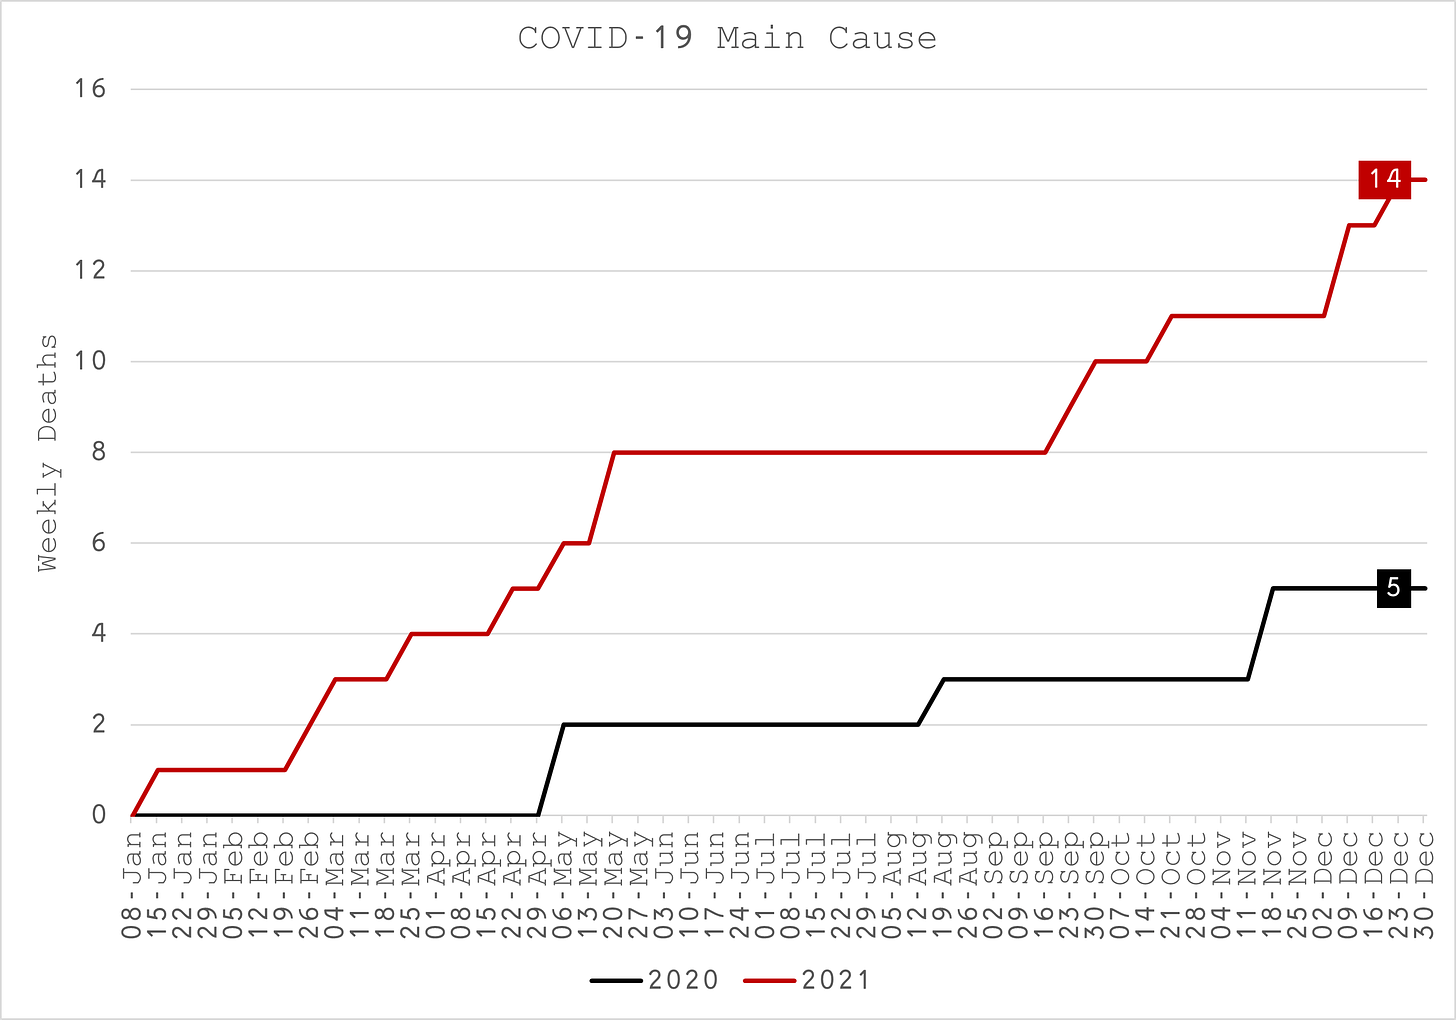
- COVID-19 was the main cause of death five times in 2020 but 14 times in 2021 with most of the deaths coming after vaccinations (Figure 17).
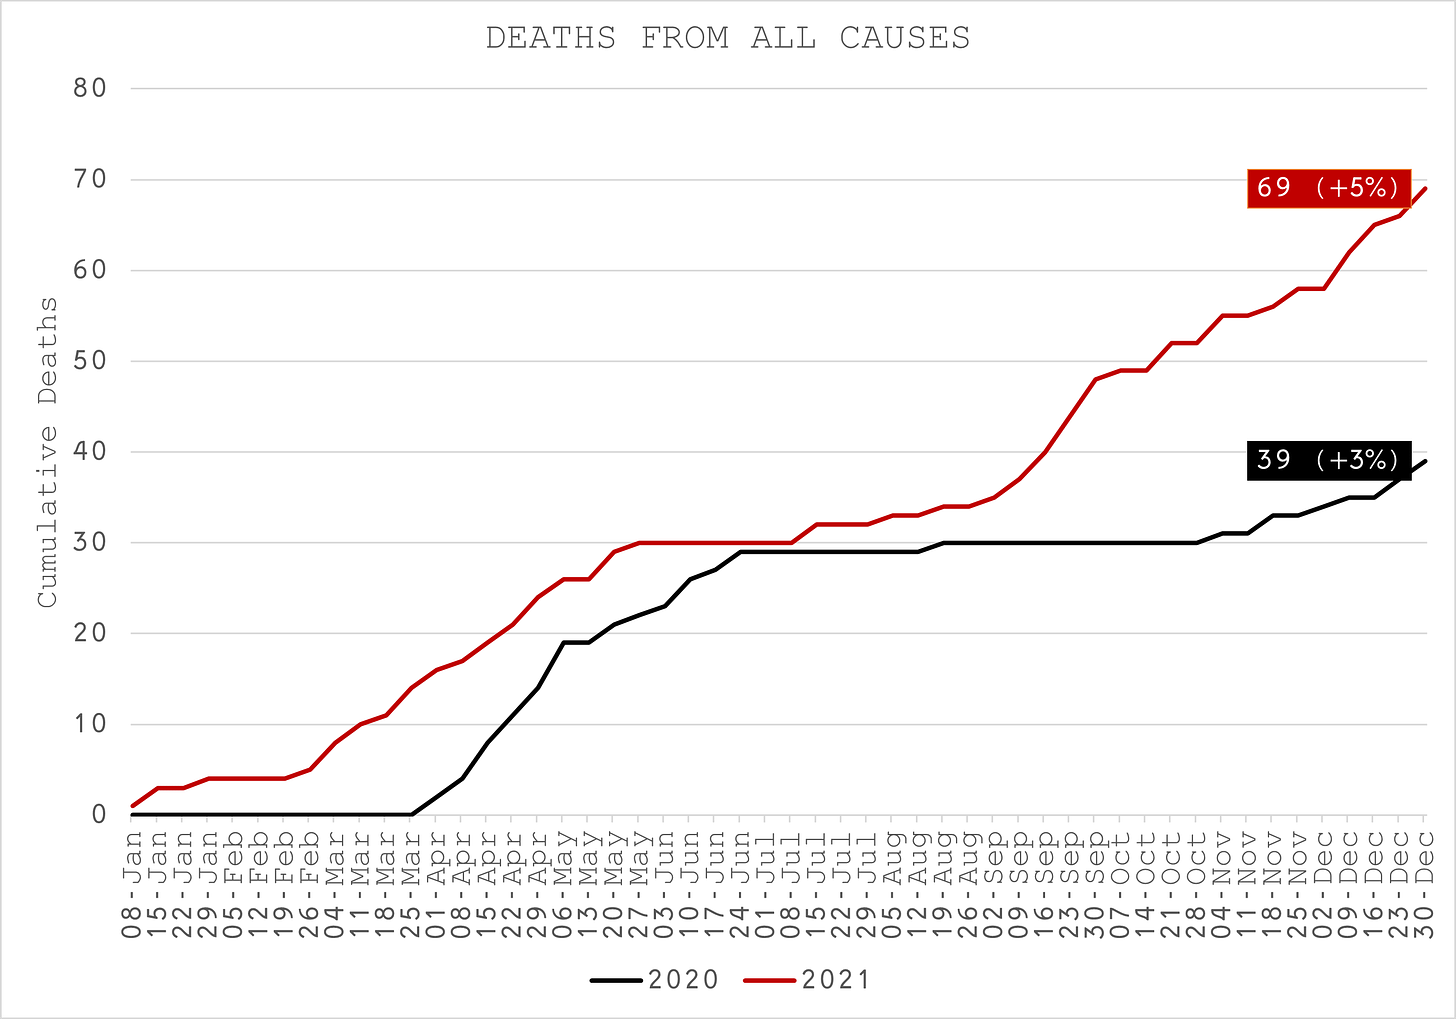
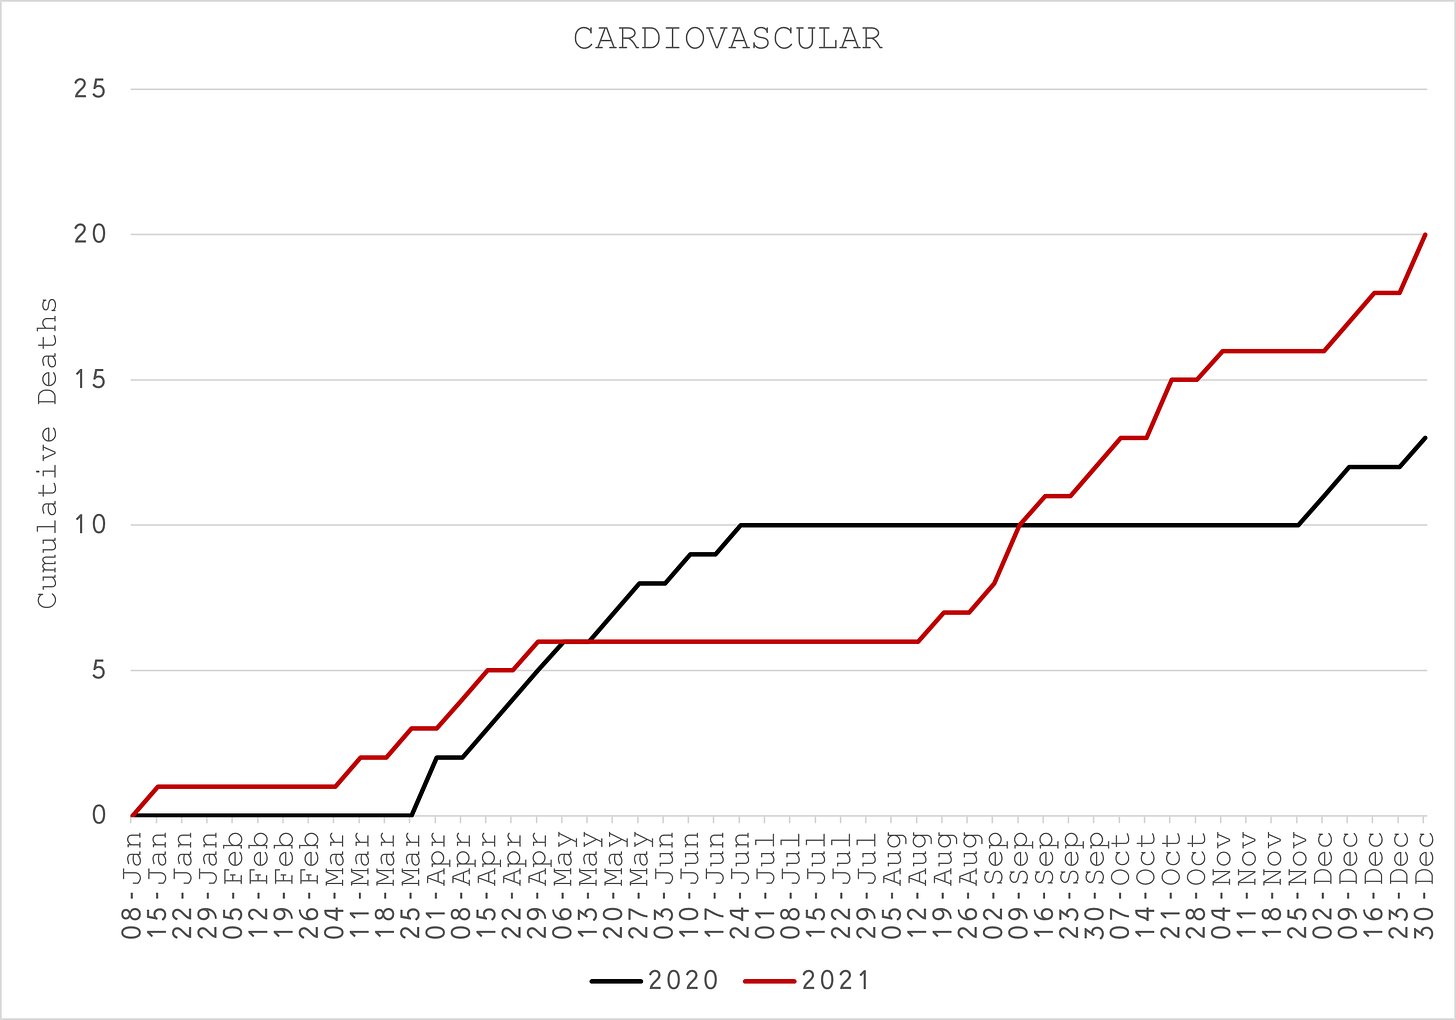
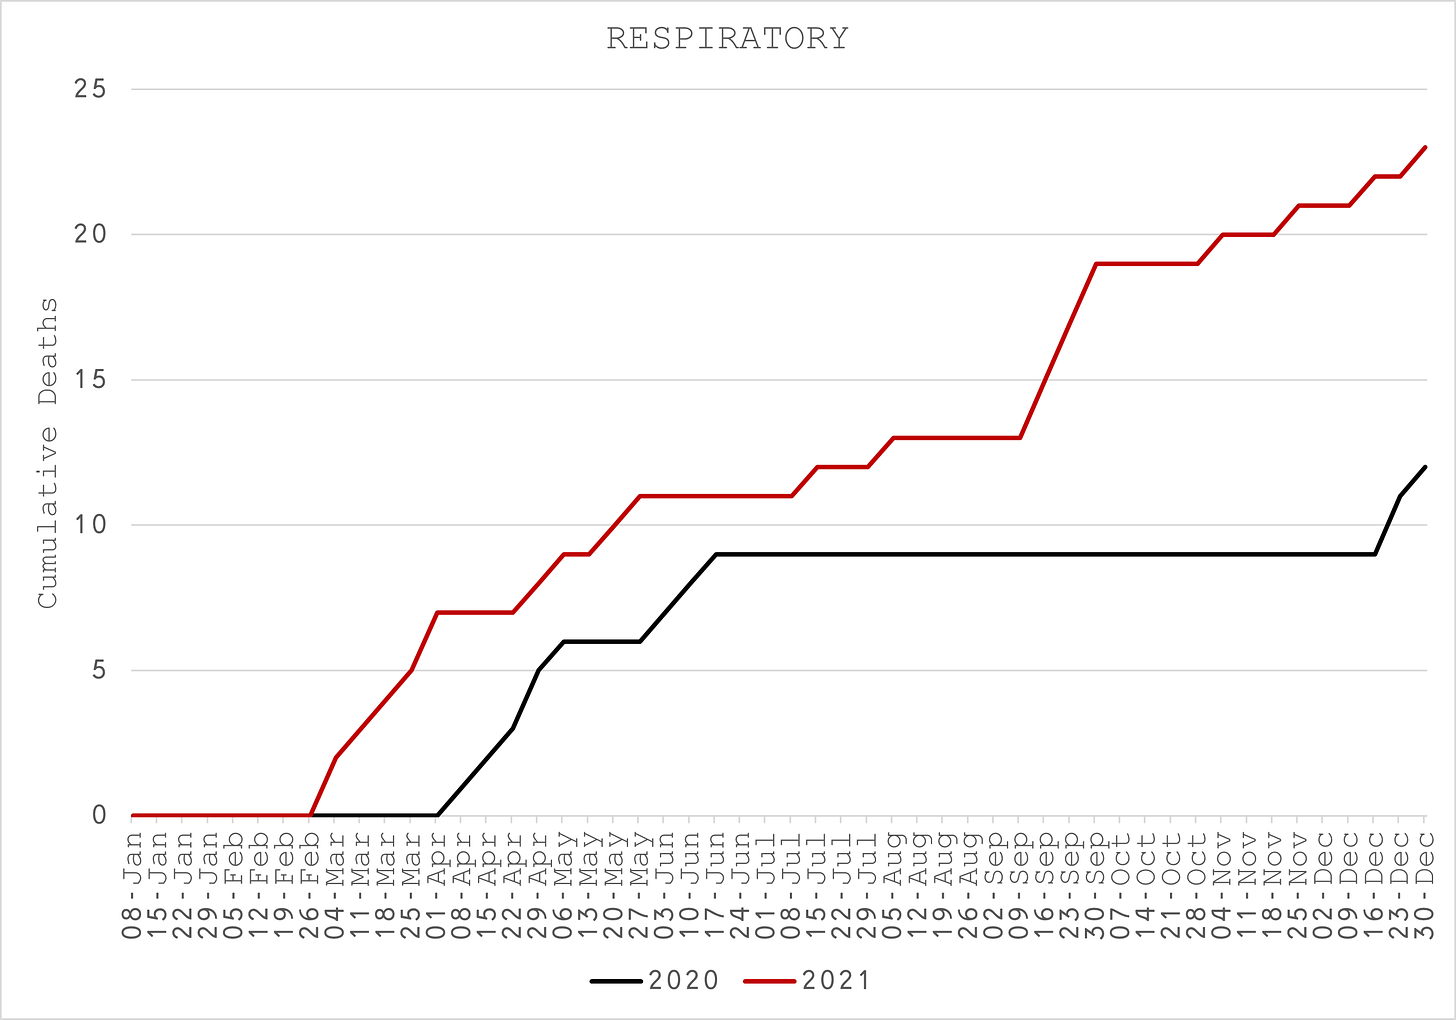
- COVID-19 was mentioned 39 times in 2020 but 69 times in 2021 (Figure 18) and is temporally associated with the excess cardiovascular (Figure 19) and respiratory (Figure 20) deaths. It is evident that the vaccination has resulted in substantially more COVID-related death in this age group.
- Blacks and Hispanic excess deaths in this age group are substantially higher than the average (Figure 21) at 32% and 52% above usual for 2020 and 2021 compared to 15% and 22% respectively.
Deaths of 40 to 64 Year Olds
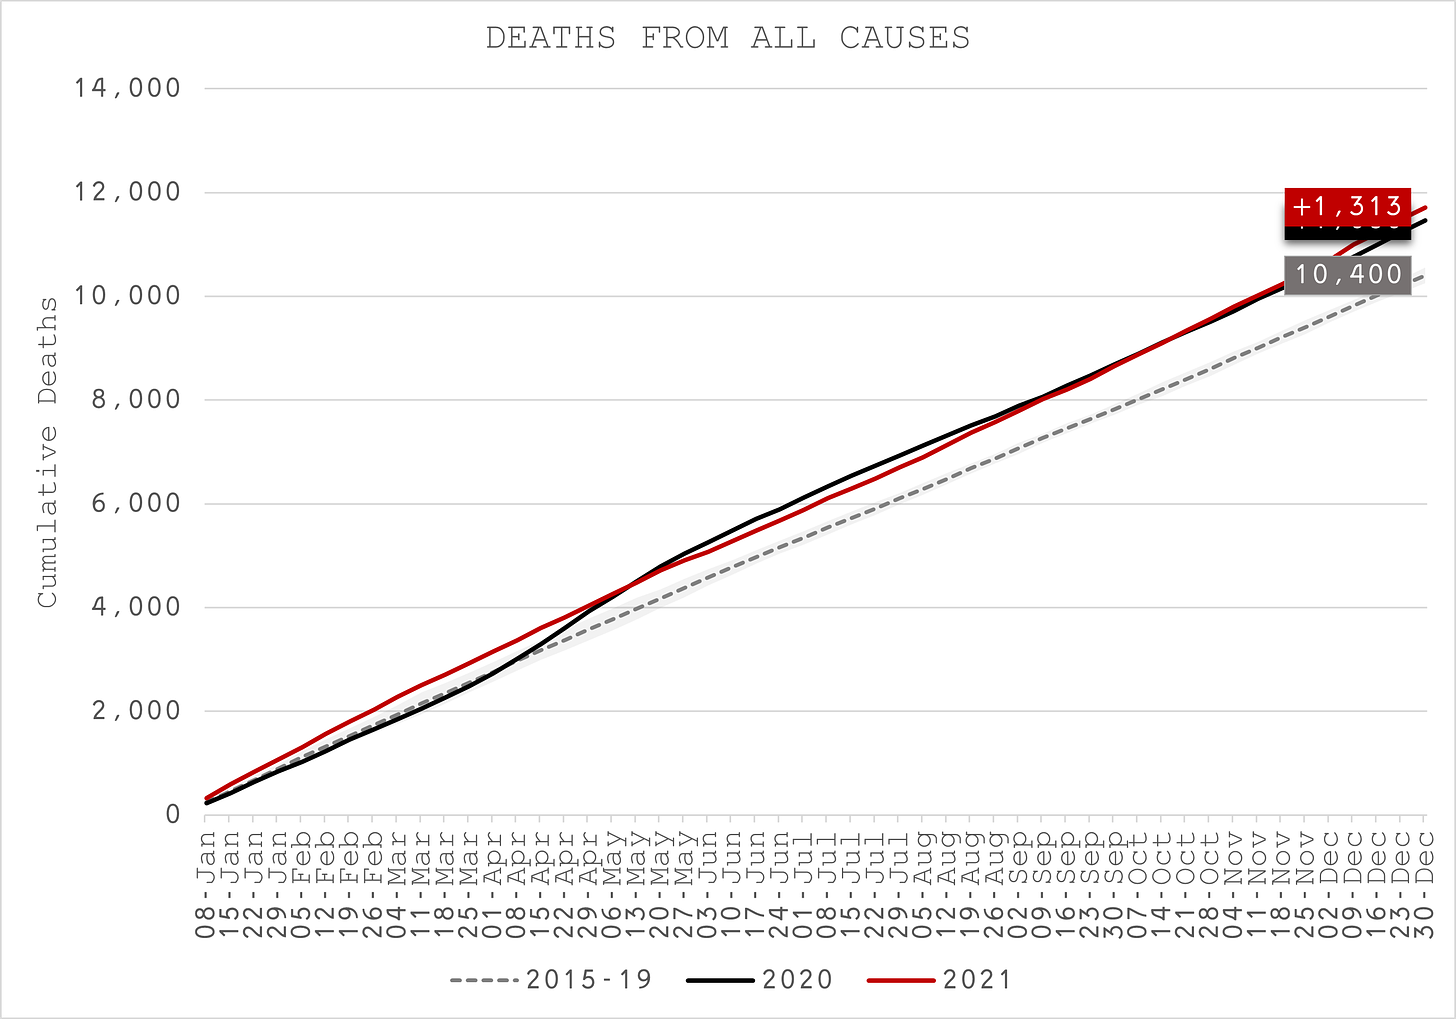
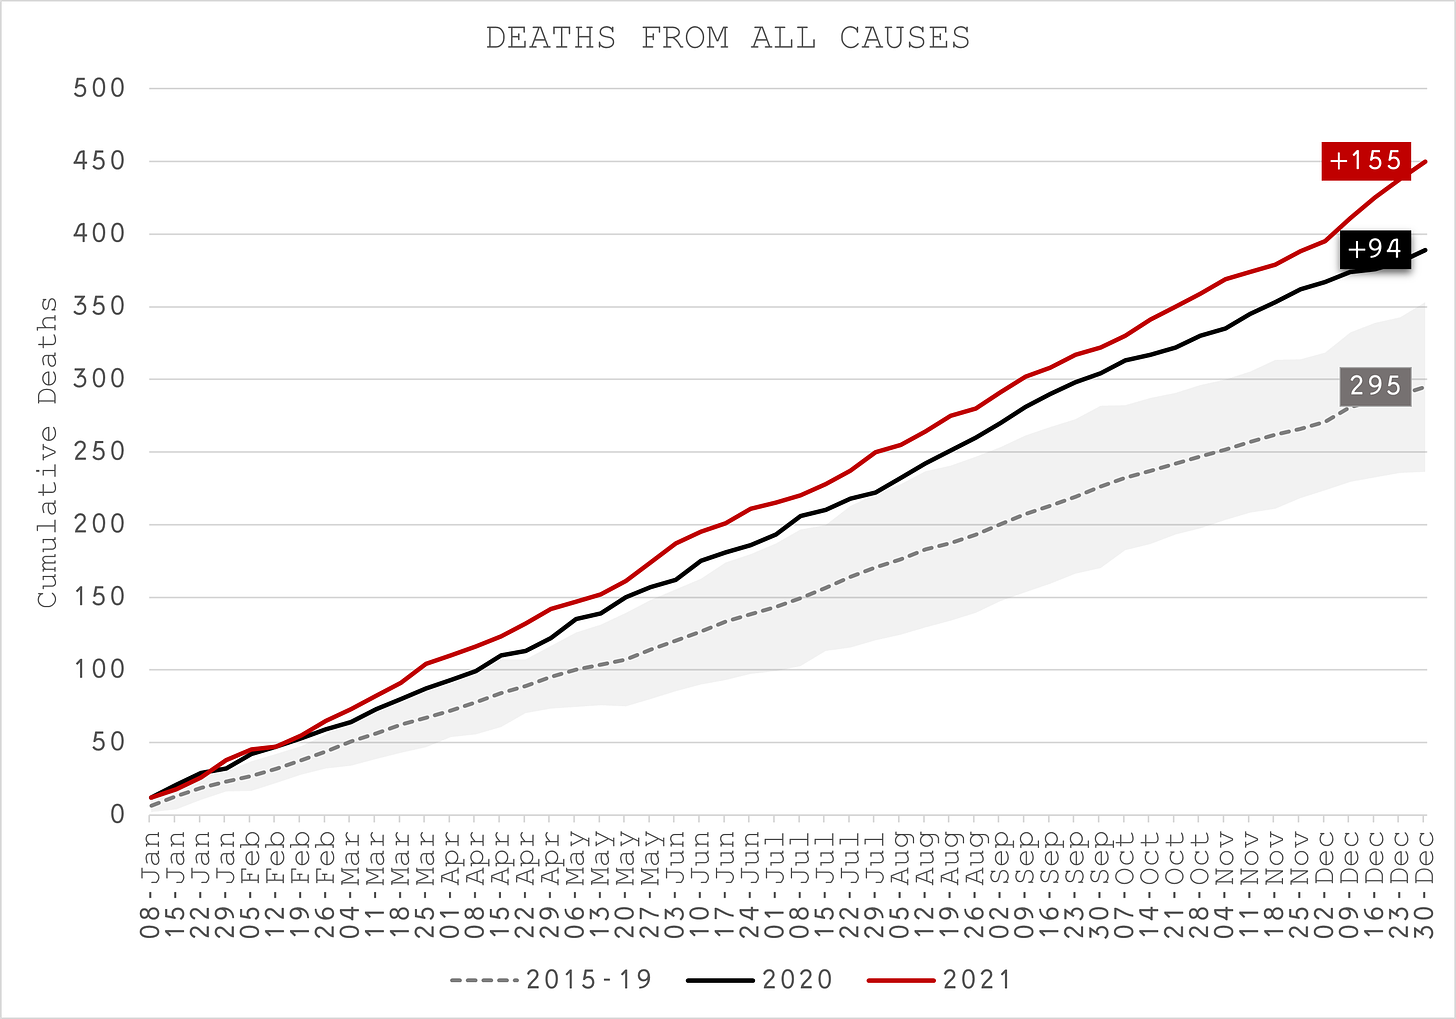
- Deaths of 40 to 49 Year Olds and 50 to 64 Year Olds have the same patterns so I have grouped them together (Figure 22). For the first time, we can see a distinct impact of COVID-19 in spring 2020. Nevertheless, 2021 ends up with more death, 12% above usual.
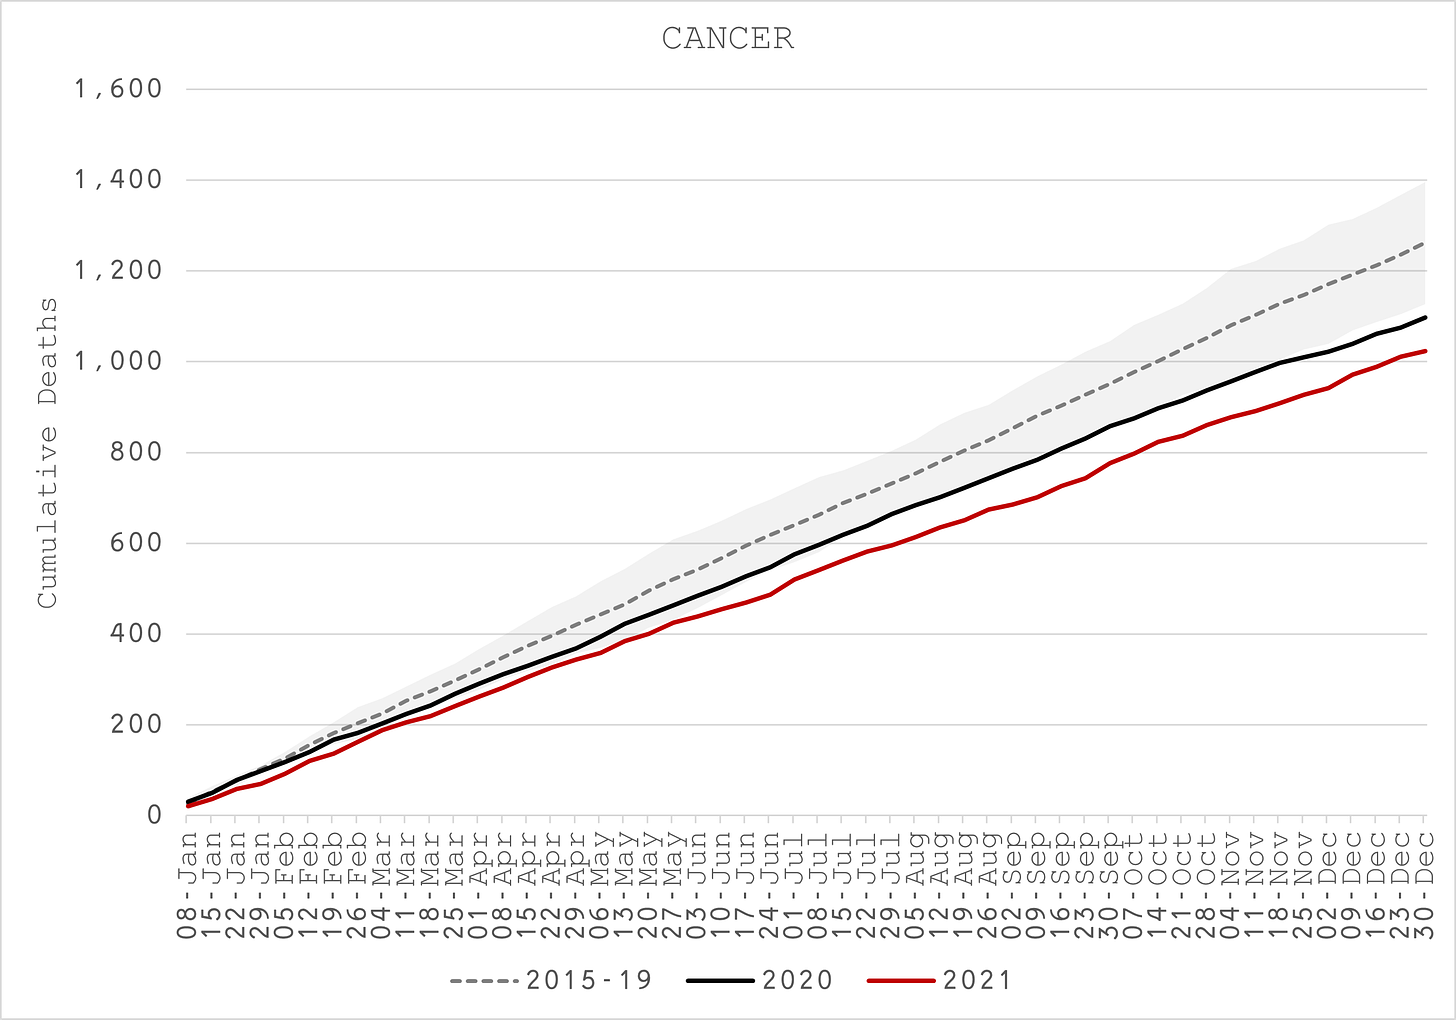
- Cancer is well below usual in 2020, suggesting COVID-19 displaced many of these deaths but even lower still in 2021 as those cancer deaths appear to have been displaced by other causes (Figure 23).
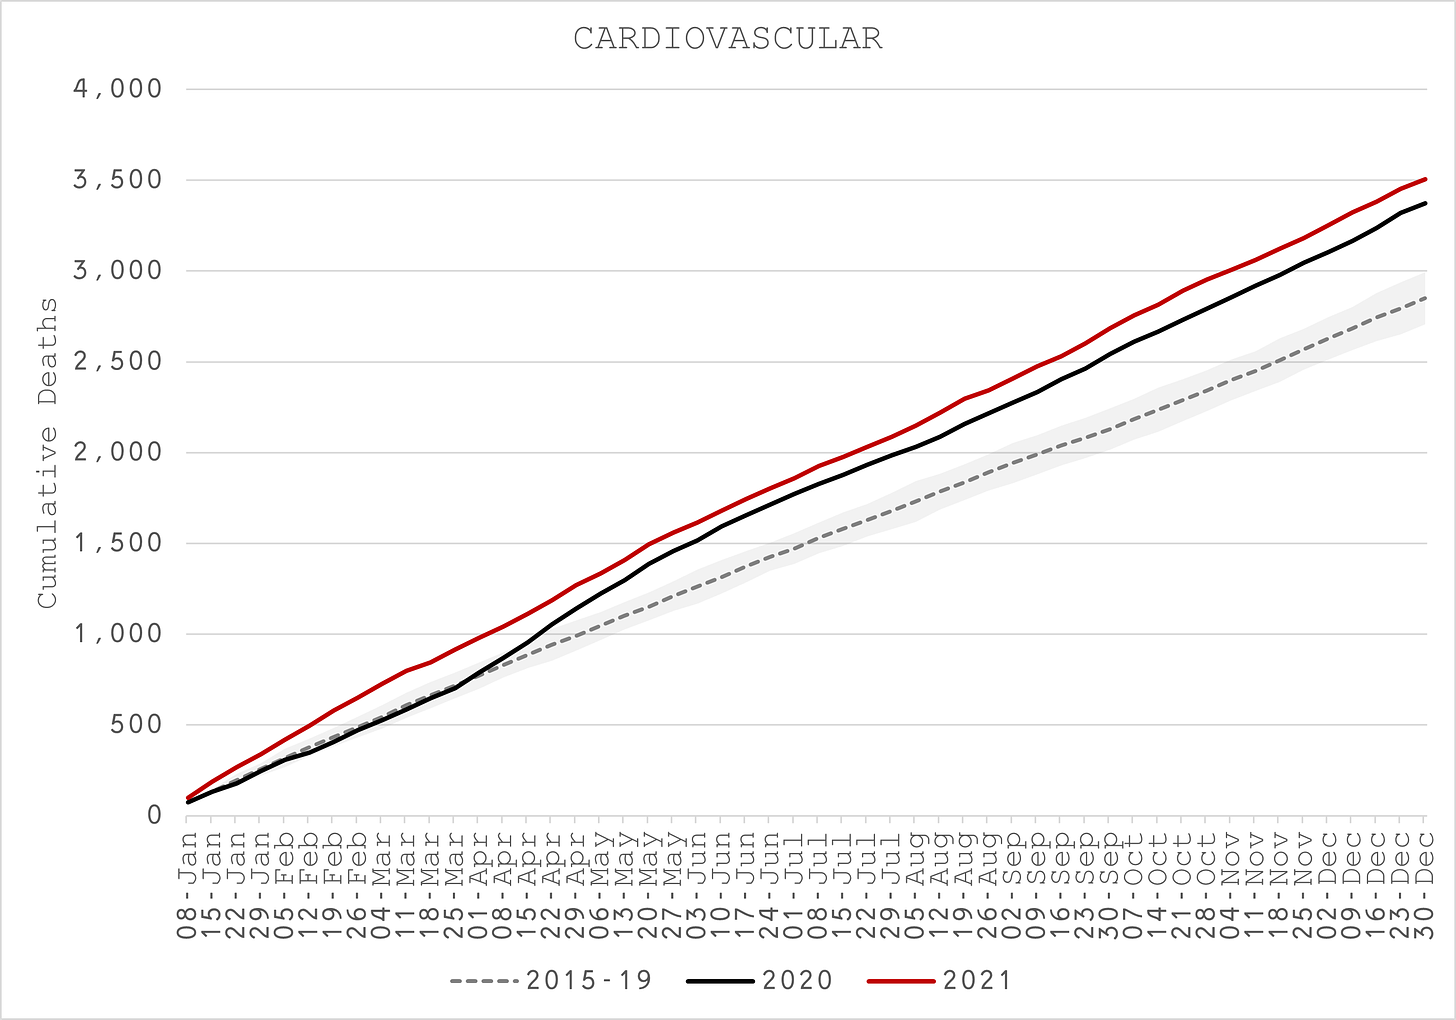
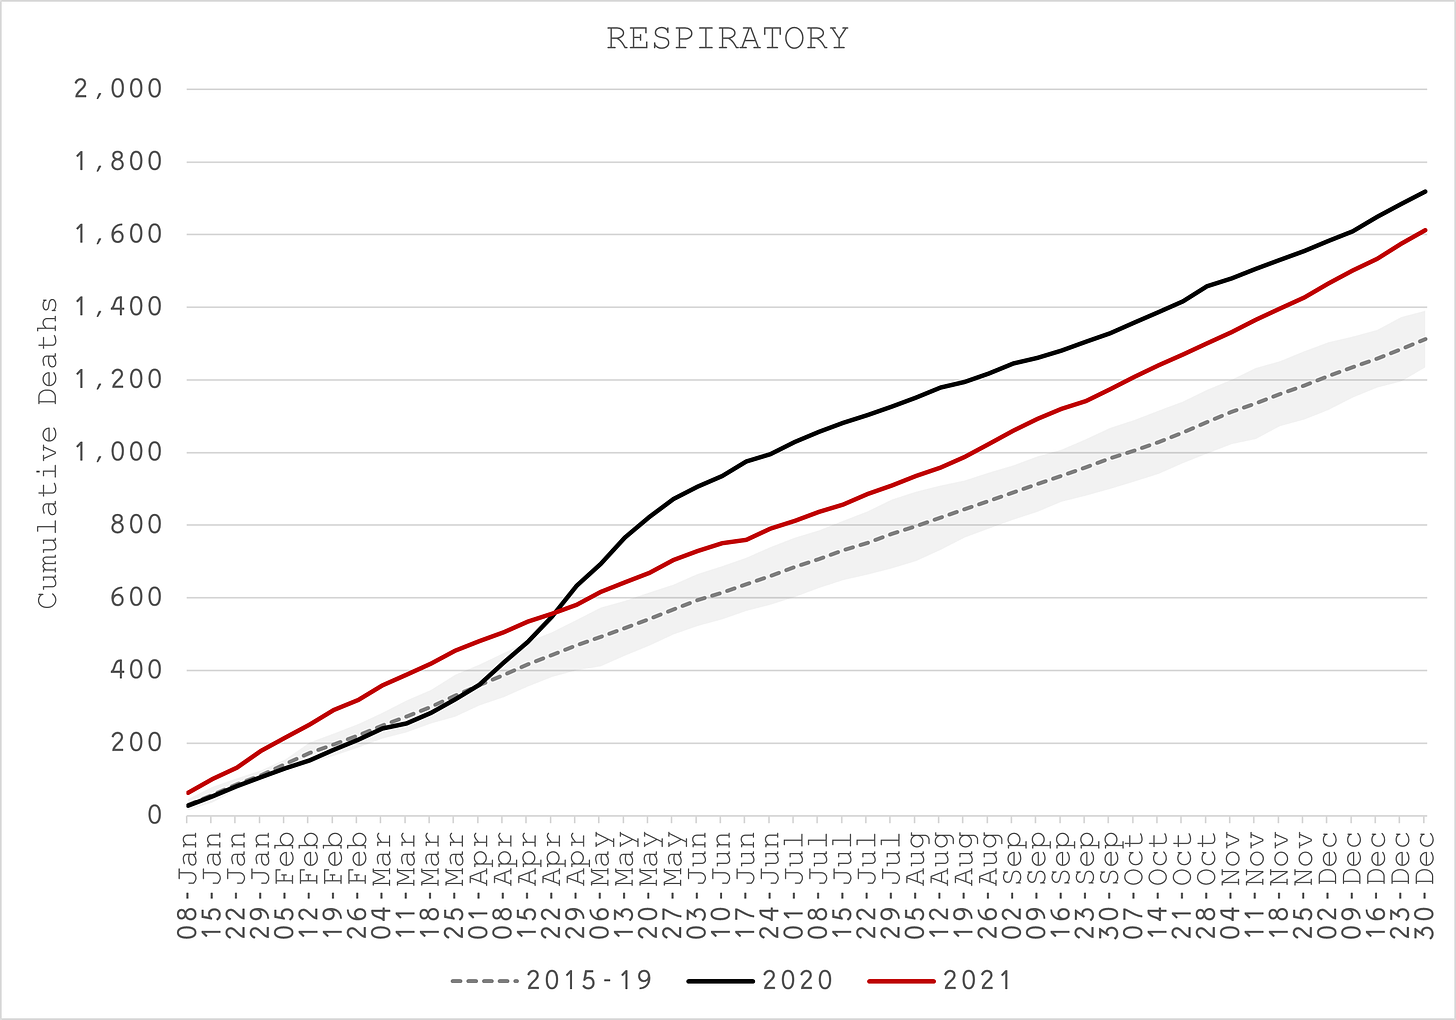
- Cardiovascular (Figure 24) and respiratory (Figure 25) account for the majority of the excess in both years.
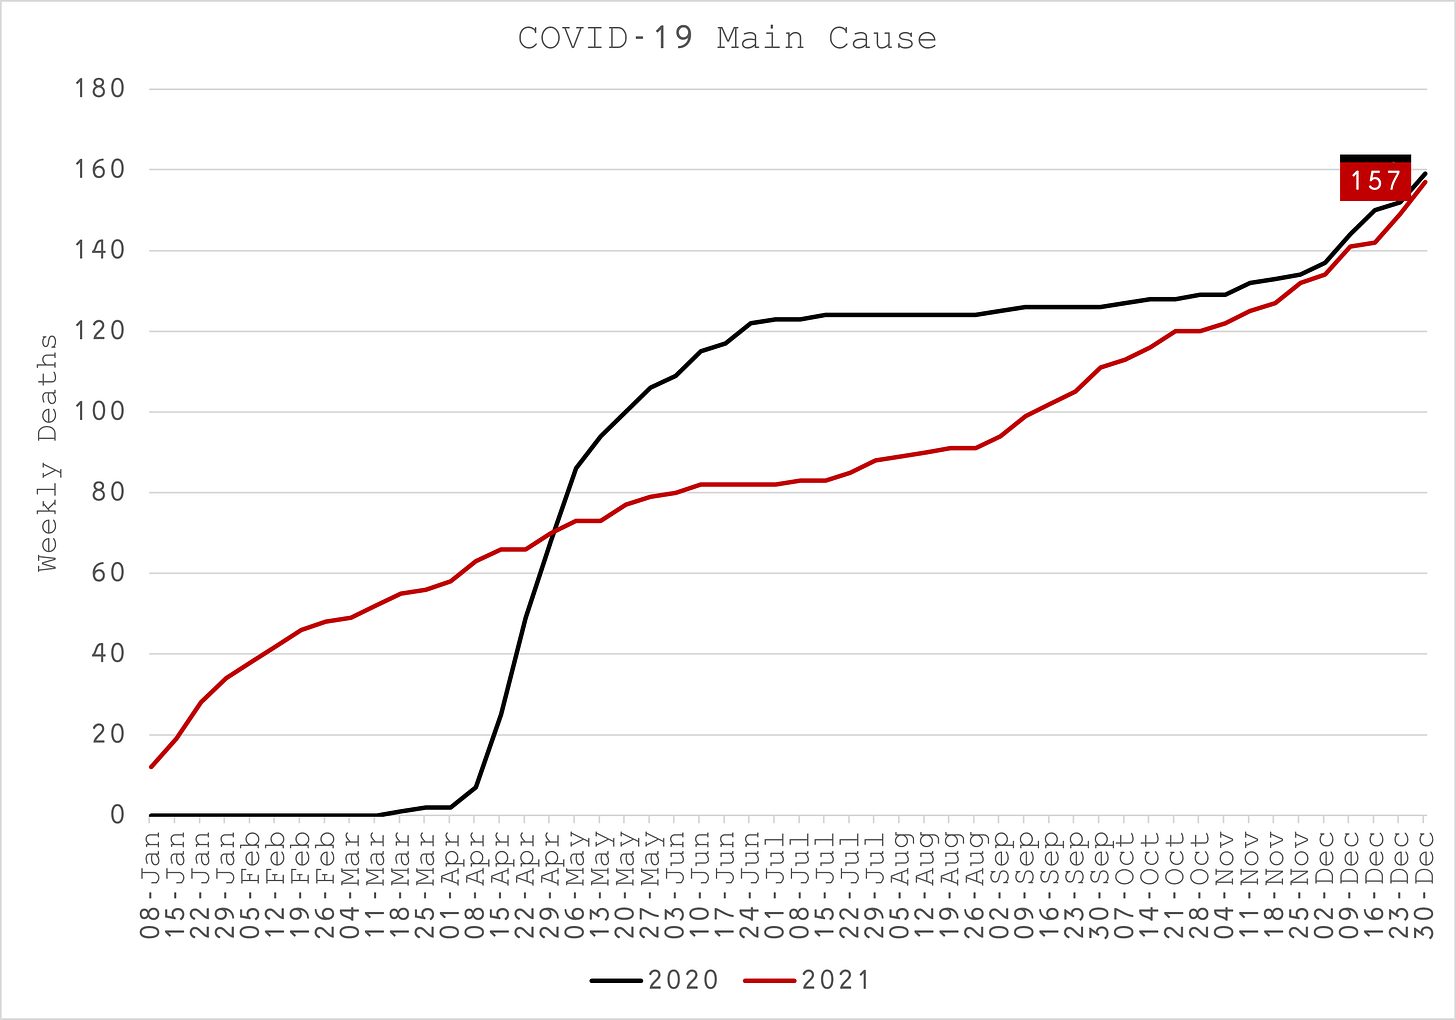
- There are the same number of deaths due to COVID-19 in both years “despite” the vaccine that is claimed to reduce mortality by up to 95% (Figure 26). More unusually, the 2021 COVID-19 mortality takes off in the middle of summer, completely out of season. Still, in both years, COVID-19 only accounts for just over 1% of all deaths which is not what you would expect given how much attention it has been given.
Deaths of 65 to 74 Year Olds
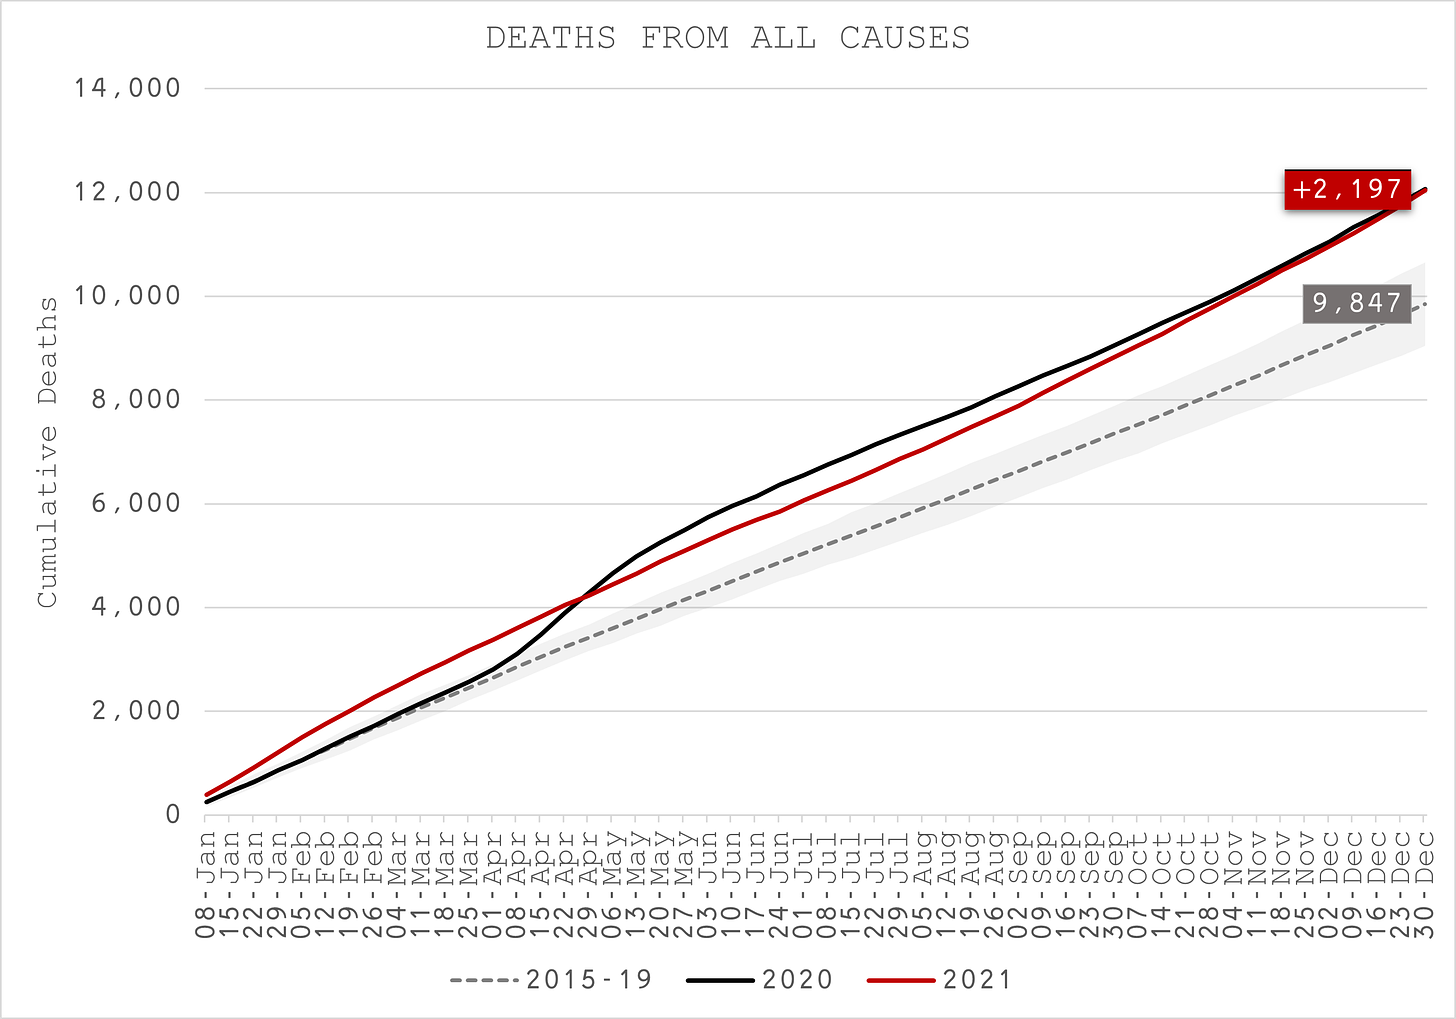
- Deaths of 65 to 74 Year Olds also show the distinct impact of COVID-19 in spring 2020. Nevertheless, 2021 ends up with the same amount of death, 22% above usual (Figure 27). Again, Blacks and Hispanics are substantially higher at more than 50%.
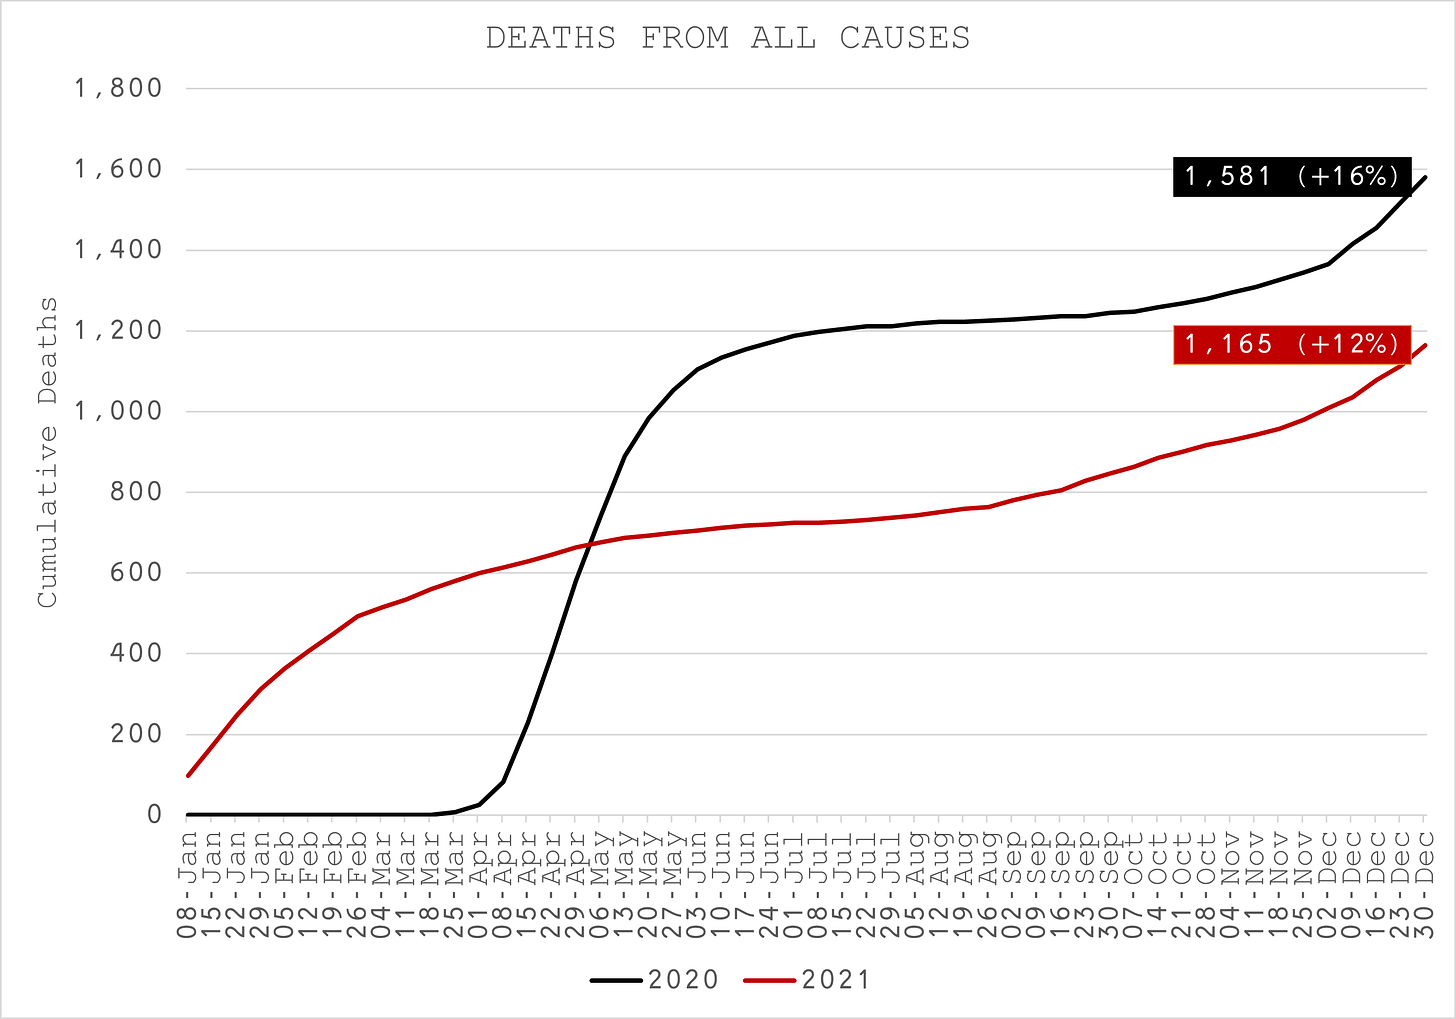
- These excesses cannot be explained by COVID-19 alone. In 2020 COVID-19 was mentioned on the death certificate 1,581 times but only 1,165 times in 2021 (Figure 28), compared to roughly 2,200 excess deaths.
- Even in this older age group, COVID-19 was only the primary cause of death in less than 2% of all deaths (Figure 29).
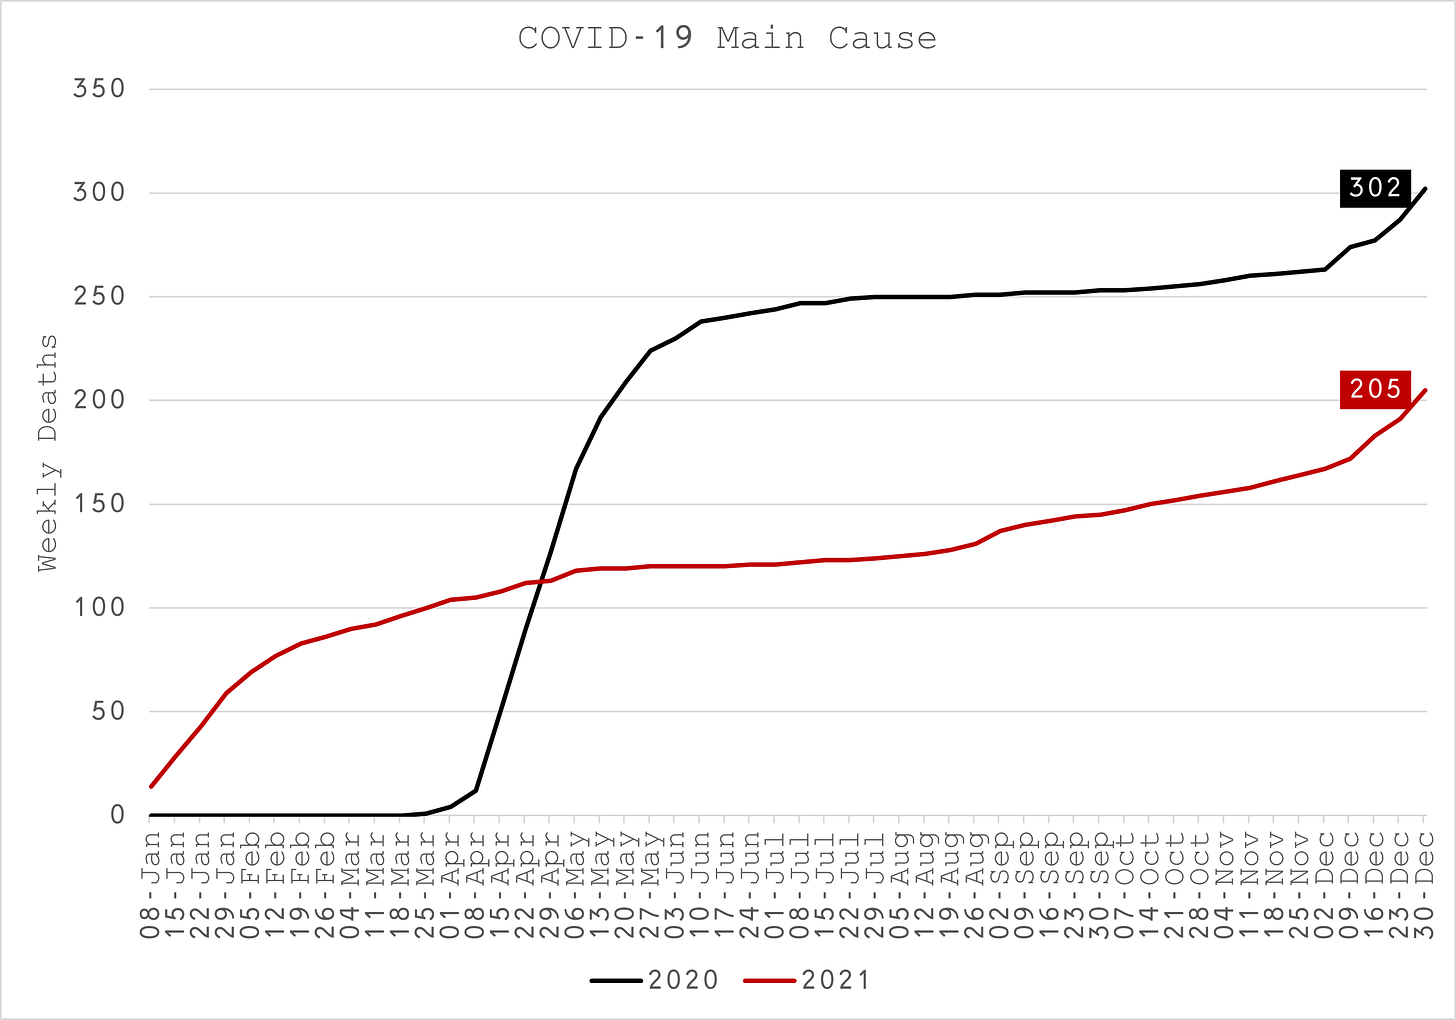
- Apart from the obvious increases in cardiovascular and respiratory diseases, the main source of non-COVID excess death in 2020 is degenerative disease (Figure 30). This is probably due to Do Not Resuscitate orders in care homes and lack of visits from family and friends. Perhaps Remdesivir also had a part to play?
Deaths of 75+ Ages
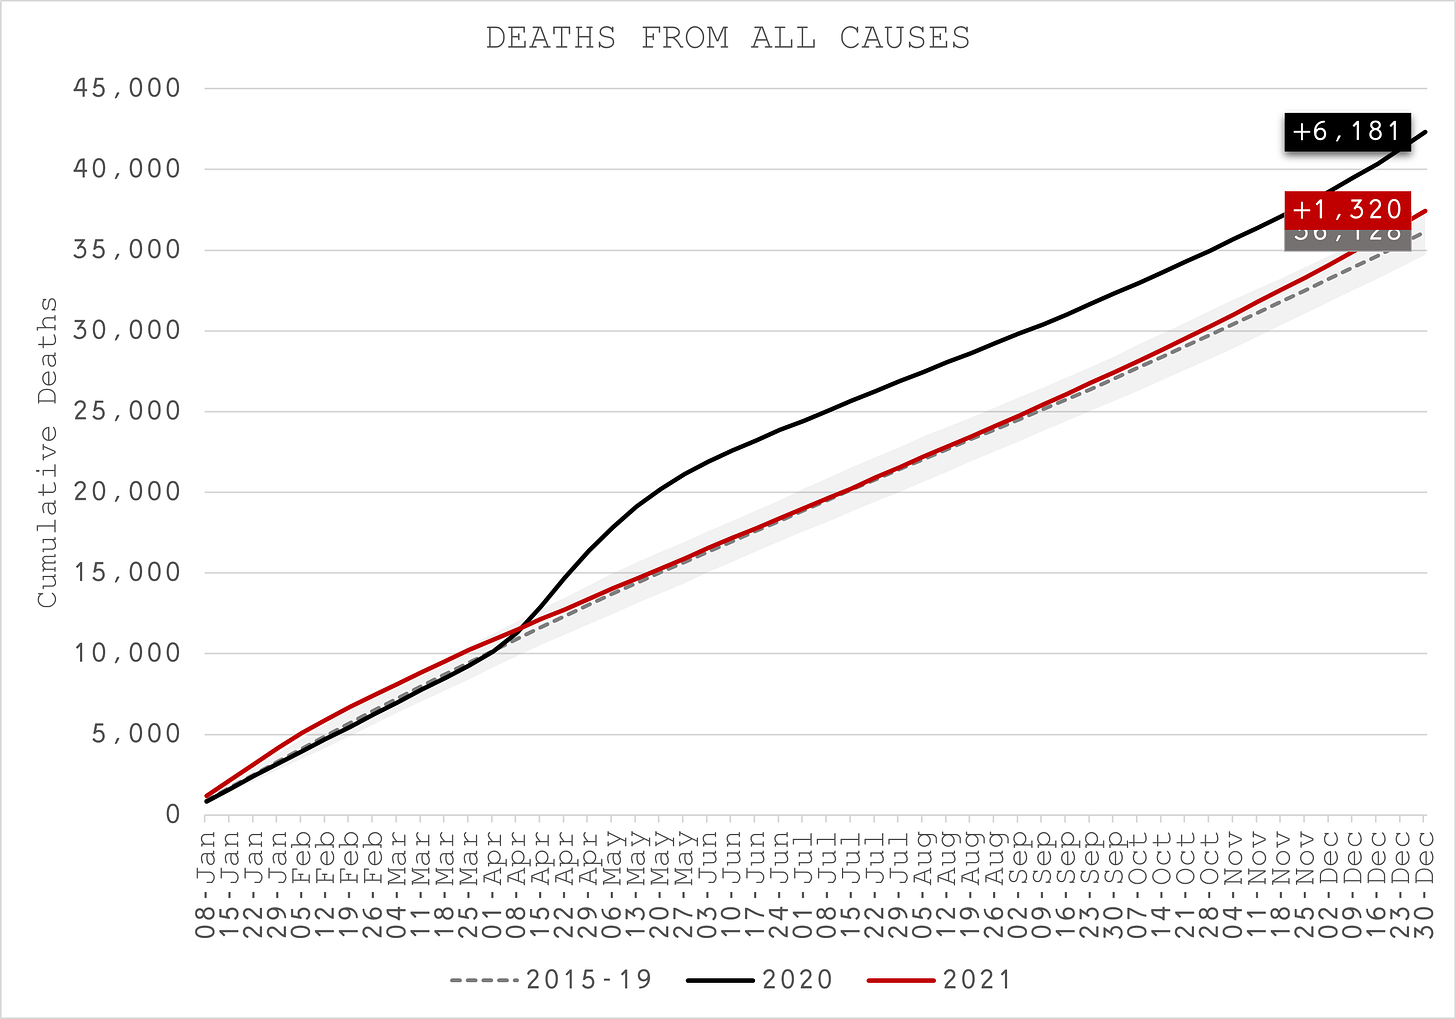
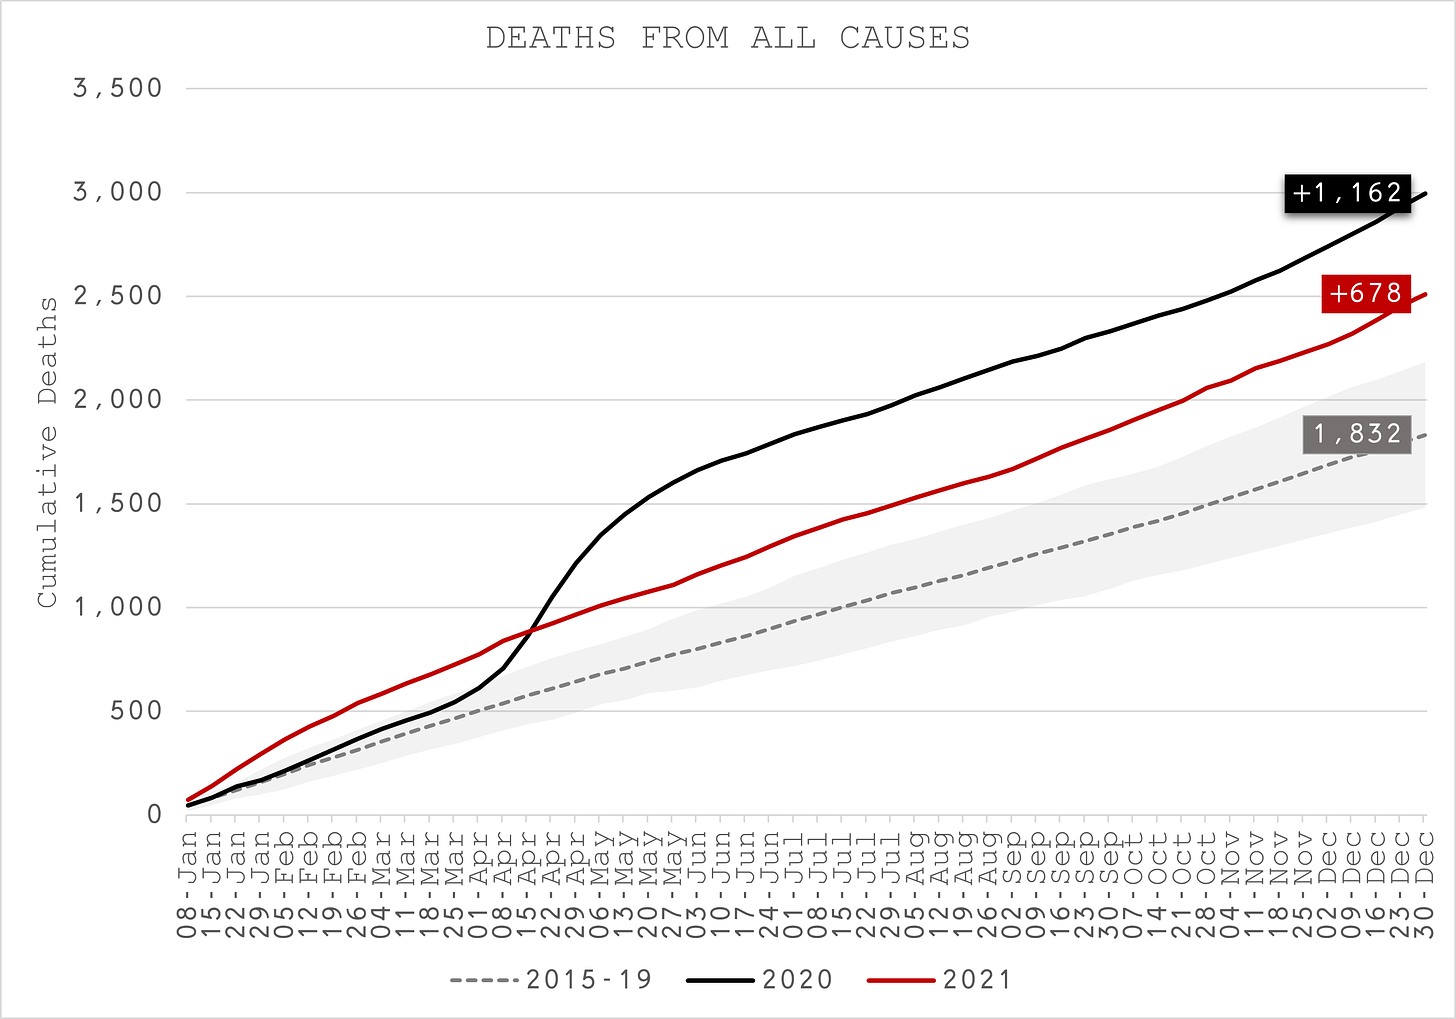
- Inevitably, deaths of those aged 75 and above shows the most pronounced impact of COVID-19 given that its heterogeneity has been known from the very first reports out of Wuhan and the Diamond Princess cruise ship. In addition, this is the only age group that shows substantially more death in 2020, the year of the pandemic than 2021, the year of the vaccine (Figure 31).
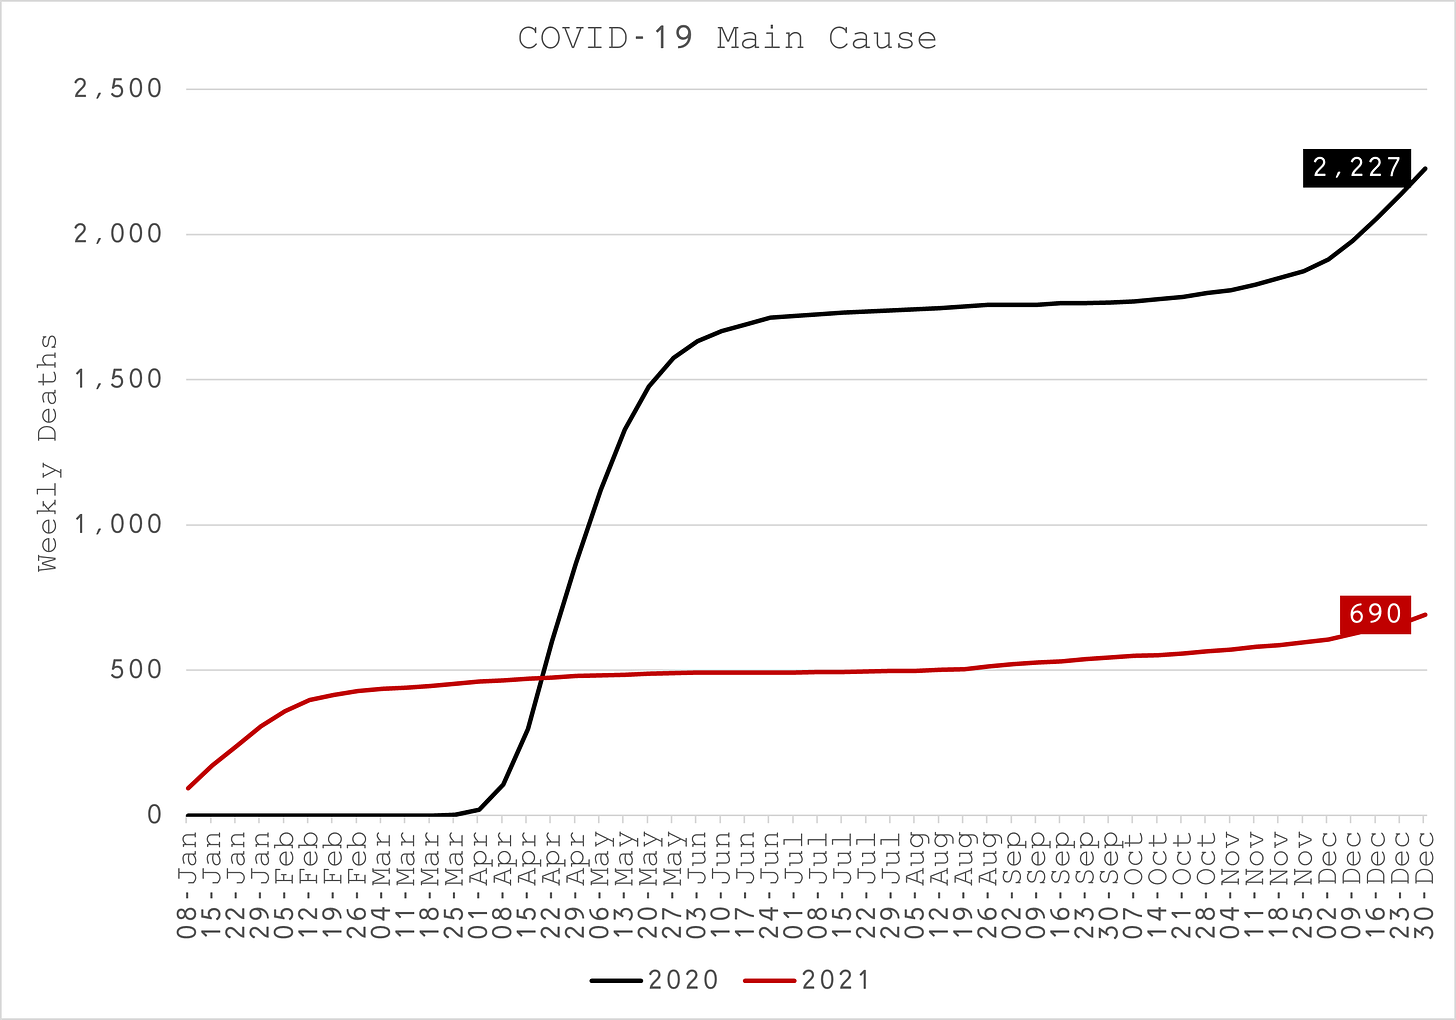
- Despite this, only one-third of the excess deaths in 2020 are due to COVID-19 as the main cause of death (Figure 32). After the seasonal winter outbreak, COVID-19 is largely absent as a cause of death for this age group. If there was any evidence at all of vaccine effectiveness, this is the only age group that shows it which really ought to be of paramount importance in terms of informing public health decisions. Alternatively, it might simply be the case that all the vulnerable succumbed in the spring wave.
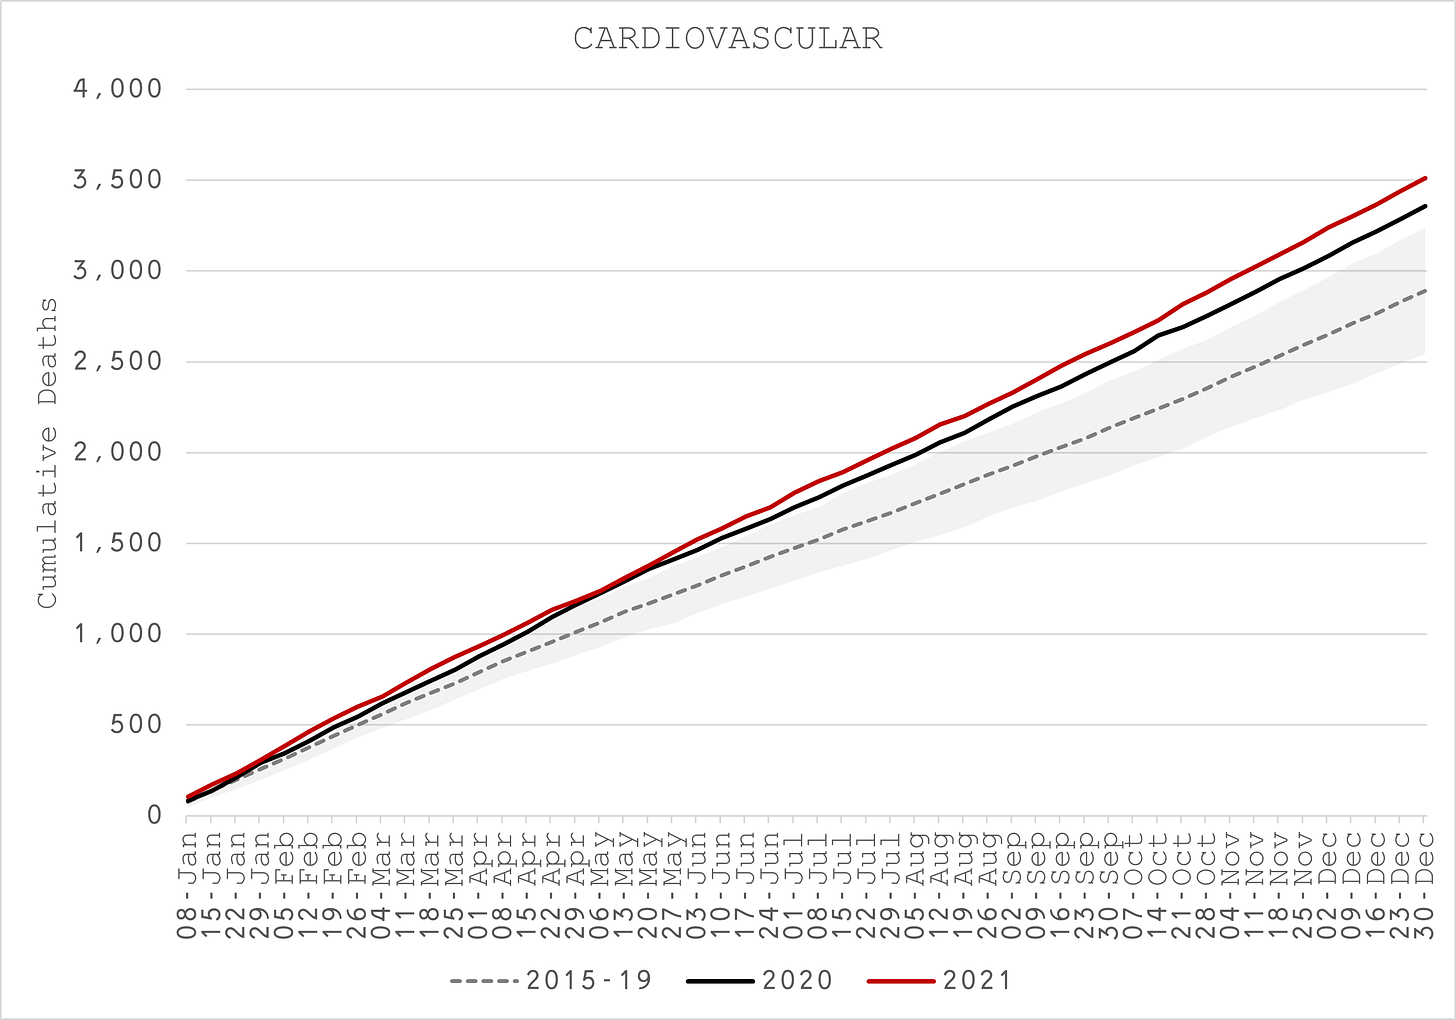
- Even the non-COVID mentioned deaths exceed expected deaths for both 2020 and 2021 driven mainly by cardiovascular (Figure 33).
- Finally again, we find that Blacks and Hispanics excess deaths are substantially higher than average at over 60% for 2020 and 37% for 2021 (Figure 34), compared to just 17% and 4% for all ethnicities respectively.
Conclusion
It is apparent that as you move younger through the age groups that overall mortality and COVID-19 mortality gets relatively worse in 2021 than 2020.
This is in stark contrast to the claims that the COVID-19 vaccine is both safe and effective. On the basis of the empirical evidence presented here, outcomes are worse for all ages under 75 in the year of COVID-19 vaccinations.
Furthermore, it is clear from the evidence that none of the non-pharmaceutical interventions have had a discernible benefit in terms of COVID-19 mortality outcomes, neither due to the disease or as a contributing factor to the main cause of death.
It is also clear that COVID-19 is insignificant in terms of solitary cause of death and not much more significant for those who are already moribund.
There is so much more in this dataset, more than one person can cover but rest assured there are many others working on to reveal every ounce of truth about the situation.
It is all being prepared for state and federal legal action so please point out any factual errors or omissions.
Thank you. ✌️
A Gompertz function with only two parameters, an initial growth rate from week 0 to week 1 and a constant exponential decay of that growth rate.

