CDC cowrote this and misrepresented the conclusions. Prior infection is unquestionably superior to vaccination at preventing both mild and severe disease
By Meryl Nass
As I was browsing CDC reports from January 2022 in the MMWR yesterday, I came across a study of cases and hospitalizations in the vaxxed and unvaxxed from the Departments of Health of California and New York, plus CDC scientist coauthors. There are several reasons why this paper is very important.
- The data came from the states themselves, which did their own calculations before CDC could apply its statistical adjustment magic and muddy the water regardign the results.
- Because NY and CA, like other states, collect vaccination data from all vaccine providers in the state, the quality of the data is likely to be very good. Other studies that rely on self-reports of vaccinations, antibody tests or medical records have less reliable data. About 3/4 of the adults were vaccinated.
- There are over 20 million people included in California’s cohort, and over 10 million in New York’s cohort, so the level of certainty about the results will be high.
Having said that, I must now warn you that the study is written up in what is an incredibly confusing way. I suspect this was done deliberately, probably by the CDC coauthors, in order to misdirect readers into focusing on the minutiae of two week periods (delineated in a 1.5 page Table 2 that should be ignored).
If you can’t dazzle them with brilliance, then baffle them with bullshit might be a crude way of describing this process.
Forget about the various waves, which are irrelevant.
In fact, I would recommend you avoid reading the text of the paper altogether, unless you want to struggle through it for a few laughs. CDC must have selected their most turgid writers to put this together.
The laughs come when you compare the Summary (Conclusions) with what the paper actually showed. More laughs can be had by reading the “at least 7 ways we might be wrong” section at the end. They are not belly laughs, but grimaces about how far “The Science” has fallen.
Instead of reading, simply study Table 1 and the Figure. You can find them at the end of the article.
https://www.cdc.gov/mmwr/volumes/71/wr/mm7104e1.htm
Or just read this sentence: “Whereas French and Israeli population-based studies noted waning protection from previous infection, this was not apparent in the results from this or other large U.K. and U.S. studies.“
Table 1.
The California (CA) data:
Vaccinated, no prior COVID vs Unvaccinated with prior diagnosis: 0.3% of each cohort wound up in hospital, i.e., vaccination was equal to natural immunity at preventing hospitalization. Not better.
How about cases?
In CA, of those who were vaccinated but had not previously had COVID, 15.5% got COVID
Of those unvaccinated but had had COVID, 5% got COVID Natural immunity was 3x better at preventing cases.
Now to the New York (NY) data:
Vaccinated, no prior COVID: 18.2% got a case of COVID.
Unvaccinated with prior COVID, 6.2% got COVID. Natural immunity was 3x better at preventing cases.
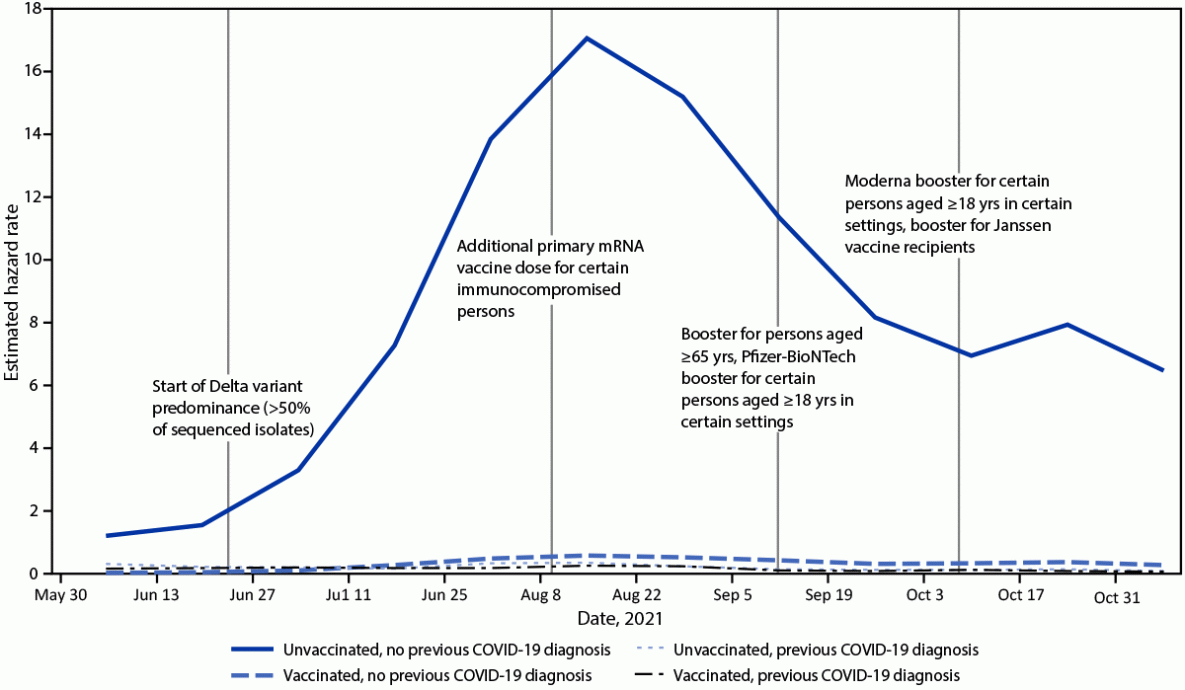
If you then take a look at the Figure, you are supposed to only notice the unbroken line representing cases in the unvaccinated who had no natural immunity.
FIGURE. Incident laboratory-confirmed COVID-19-associated hospitalizations among immunologic cohorts defined by vaccination and previous diagnosis histories — California, May 30–November 13, 2021*,†

But turn your attention to the broken lines that hug the X axis of the graph. They reveal that from July till early November 2021, when the data collection ended, natural immunity provided better protection aganst hospitalization than vaccination.
How did CDC report this? They deliberately misrepresented the results, concluding that everyone needed vaccinations, even those with natural immunity.
Scientific misconduct is a crime when the researchers used DHHS funds for their research. Misrepresentation of results falls under the rubrik falsification. Here are CDC’s conclusions:
https://www.cdc.gov/mmwr/volumes/71/wr/mm7104e1.htm
What are the implications for public health practice?
Although the epidemiology of COVID-19 might change as new variants emerge, vaccination remains the safest strategy for averting future SARS-CoV-2 infections, hospitalizations, long-term sequelae, and death. Primary vaccination, additional doses, and booster doses are recommended for all eligible persons. Additional future recommendations for vaccine doses might be warranted as the virus and immunity levels change.

