In a country-level analysis, variation in vaccine uptake was related to the number of new cases, but not in the way you would expect if vaccines prevent transmission and reduce symptoms.
This phenomenon is called “original antigenic sin”, and has been known in virology since the 1950’s. The vaccine may also induce a short-term immunodeficiency. Further, if thimerosal-containing influenza vaccines are given at the same time as COVID-19 vaccines, further immunodeficiency can result due to inhibition of a protein called ERAP1. I’ve provided references to this literature ad nauseum across social media.
If this is what we’re seeing, then COVID-19 vaccination must stop immediately worldwide – and a systematic program to boost the immune system in everyone – and means of early treatment that I have addressed since March 2020 – especially those popularized by the medical experts – must begin in earnest. I’m now re-publishing this analysis on #PopularRationalism due to its greater reach.
I’m heavily shadowbanned on social media. Please share, everywhere.
= James Lyons-Weiler, PhD, 11/22/2021
OWID is a unique and rich online data resource that has been tracking COVID-19 cases throughout the pandemic.
They recently added vaccination data to their data. Well, sort of.
Here, OWID provides a chart of SOME countries’ vaccination rates.
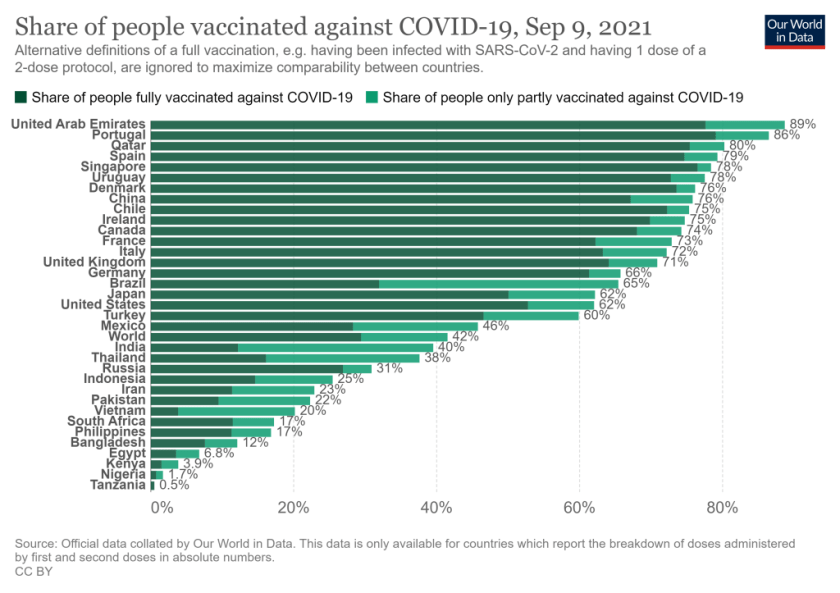
Why one cannot access the vaccination uptake data from all countries is unclear. In fact, no one can access the vaccination rate data from any country via their interface or by downloading the datafile. When one downloads the data for their chart, or does an individual country query, one finds that the vaccination rate data are not present.
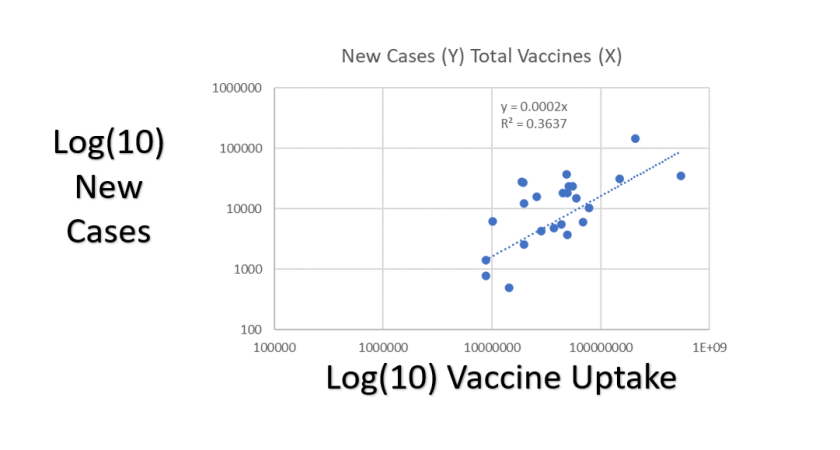
So, using the numbers from their chart (not scaled for population size), I typed in the vaccination uptake data and then, using their data on the number of new cases reported (9.9.2021 entries), I could plot the number of new cases by vaccination uptake. Plotted on a log scale with a necessary fixed zero intercept model, that looks like this:
Wait, you say. There is a third variable that could explain this completely you say. Population size. Right. So, when we correct for population size by calculating the number of vaccines per capita and number of new cases per capita, we get a plot that looks like this (plotted on linear scale; Y-axis = New Cases per Capita, X-axis = Vaccines Per Capita).
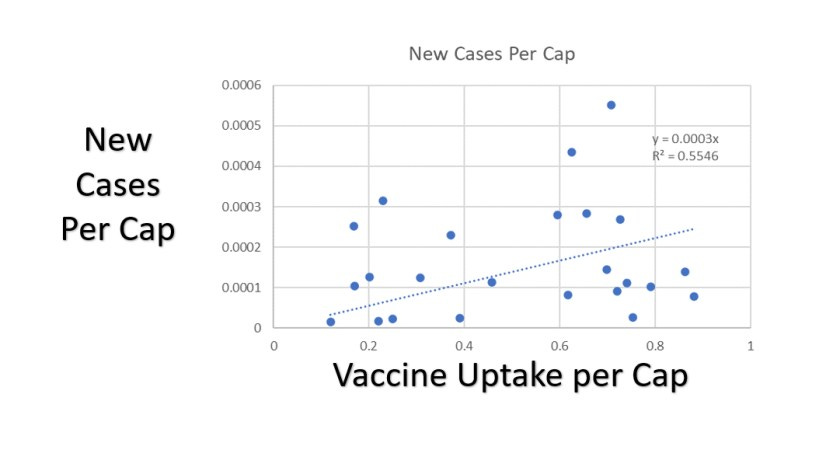
The coefficient (slope = 0.0003) is even larger, as is the R-squared value. The data suggest that for every vaccination given per person in a country, we get an INCREASE of 3/1000ths of a new case of COVID-19 per person in the country. Another way to look at it, for every 3000 people who are vaccinated per person in a country, we get an extra case of COVID-19 per person in the country. Wait, what? Isn’t it suppose to be a reduction in the number of cases?
There are number of plausible explanations for this. Is this evidence for Antibody Dependent Enhancement? Could be; contrary to false so-called fact-checking websites and articles that claim that the mRNA vaccines encode the protein that contributes least to ADE, the mRNA vaccine produce the protein second most likely to cause ADE. Is it Pathogenic Priming? My analyses from April 2020 and follow-up validation of my predictions suggest yes, sure, some people might experience Pathogenic Priming. Original Antigenic Sin? Possibly.
There are other possible causes of worsening public health under widespread vaccination. Perhaps people who vaccinate more are also more likely to receive thimerosal-containing influenza vaccines, which silences the protein ERAP1, essential for antigen folding for APC (antigen presentation) cells? Or perhaps the fiscal incentives in play rewarding medical facilities for diagnosis are correlated with financial incentives in play for vaccination?
Either way, it is accurate to say, at a minimum, that current real-world data suggest that total vaccination uptake is not reducing the number of newly reported cases of COVID-19.
This can be seen in the 1:1 comparison of rates between Israel in the United States, as has been pointed out by Tony Lin:https://www.youtube-nocookie.com/embed/DWj_Z9qqPZY?rel=0&autoplay=0&showinfo=0&enablejsapi=0
My analysis was limited in a number of way. First, by virtue of the limited access to vaccination rate data at OWID, it was to countries for which I could access data on vaccine uptake from their graph, and those did not distinguish between once- or twice-jabbed rates. I also excluded the data from China due to an unbelievably low new case rate of 17.
If you know details about OWID I don’t know that could explain these trends, please share them in the comments below. I’m open for rational discourse. Ad-hominem BS will be ignored.
Here is spreadsheet I used for my analyses: